TL;DR
Upload a CSV and Mitzu's Configuration Agent sets up your full workspace automatically — no warehouse connection needed to get started. The agent finds your timestamp and event columns, maps identifiers, and models the dataset the same way it does after a warehouse connection. Static data quirks are handled: the analysis window is pinned to where your events actually end.
Upload a CSV — a file you already have — and Mitzu's Configuration Agent sets up your whole workspace from it. No warehouse to connect, no connection request to wait on.
1. What happens when you upload a CSV
Drop in the file and the Configuration Agent takes over. It reads the data, finds your timestamp and event columns, maps user identifiers, and models the dataset — the same setup that normally follows a warehouse connection, handled automatically.
The agent also handles the quirks of static data. A live warehouse connection always has a current date to anchor the analysis window to. A CSV doesn't — the data ends where it ends. Mitzu pins the analysis window to where your events actually stop, so retention curves and funnels compute correctly rather than showing artificially empty periods at the tail.
2. What you can do from a CSV
From there your CSV behaves like any warehouse-backed dataset. The same funnels, retention curves, segmentations, and user journeys. The same Analytics Agent — and it will suggest the first questions worth asking off your own data.
- Funnel analysis — build a signup-to-activation funnel, set a conversion window, break it down by property.
- Retention — define a cohort by their first event, pick a return event, see how they come back over time.
- Segmentation — filter by any column the agent mapped as a user property, group by dimension.
- Analytics Agent — ask questions in natural language and get answers grounded in your data, not invented.
3. The fastest way to see Mitzu on real data
Most evaluations start with sample data someone else prepared. That's useful for understanding the interface, but it doesn't tell you whether Mitzu works on your event schema, your column names, your quirks.
CSV upload makes the evaluation real. Export a slice of your event log from wherever it lives — a warehouse you don't control yet, a third-party tool, a spreadsheet export — and drop it in. In minutes you have a working Mitzu workspace built from your own data.
4. The path to live data
CSV is a starting point, not a permanent mode. Mitzu is a warehouse-native platform — for ongoing analytics, event data needs to live in a modern cloud warehouse: Snowflake, BigQuery, Databricks, Redshift, or ClickHouse. When you're ready, connect your warehouse and everything scales from there.
The configuration the agent built from your CSV — the event mappings, the identifier logic, the column decisions — carries over as a starting point for the warehouse setup. You're not starting from scratch.
Frequently asked questions
What CSV format does Mitzu accept?
A standard event-log CSV: one row per event, a timestamp column, a user identifier column, and an event name column. Additional columns are treated as event properties and mapped automatically. See the CSV upload documentation for exact format requirements.
Does CSV upload require a warehouse?
No — that's the point. CSV upload is the one path into Mitzu that doesn't require a warehouse connection. Upload the file and the Configuration Agent sets up your workspace from it directly.
Is there a file size limit?
See the CSV upload documentation for current file size limits. For large event histories, a warehouse connection is the right path.
What happens to my configuration when I connect a warehouse?
The event mappings and identifier logic the Configuration Agent built from your CSV carry over as a starting point for the warehouse setup. You can review, adjust, and extend them — you're not starting from scratch.
Why does Mitzu pin the analysis window for CSV data?
A CSV is a snapshot — the data ends where it ends. If Mitzu anchored the analysis window to today's date, retention curves and funnels would show empty periods after the last event in the file. Instead, the analysis window is pinned to the end of your actual event history, so every chart reflects the real shape of the data.
Get started
Export a slice of your event data as a CSV and upload it at app.mitzu.io. The Configuration Agent handles the rest. Full instructions are in the CSV upload documentation.
Related reading
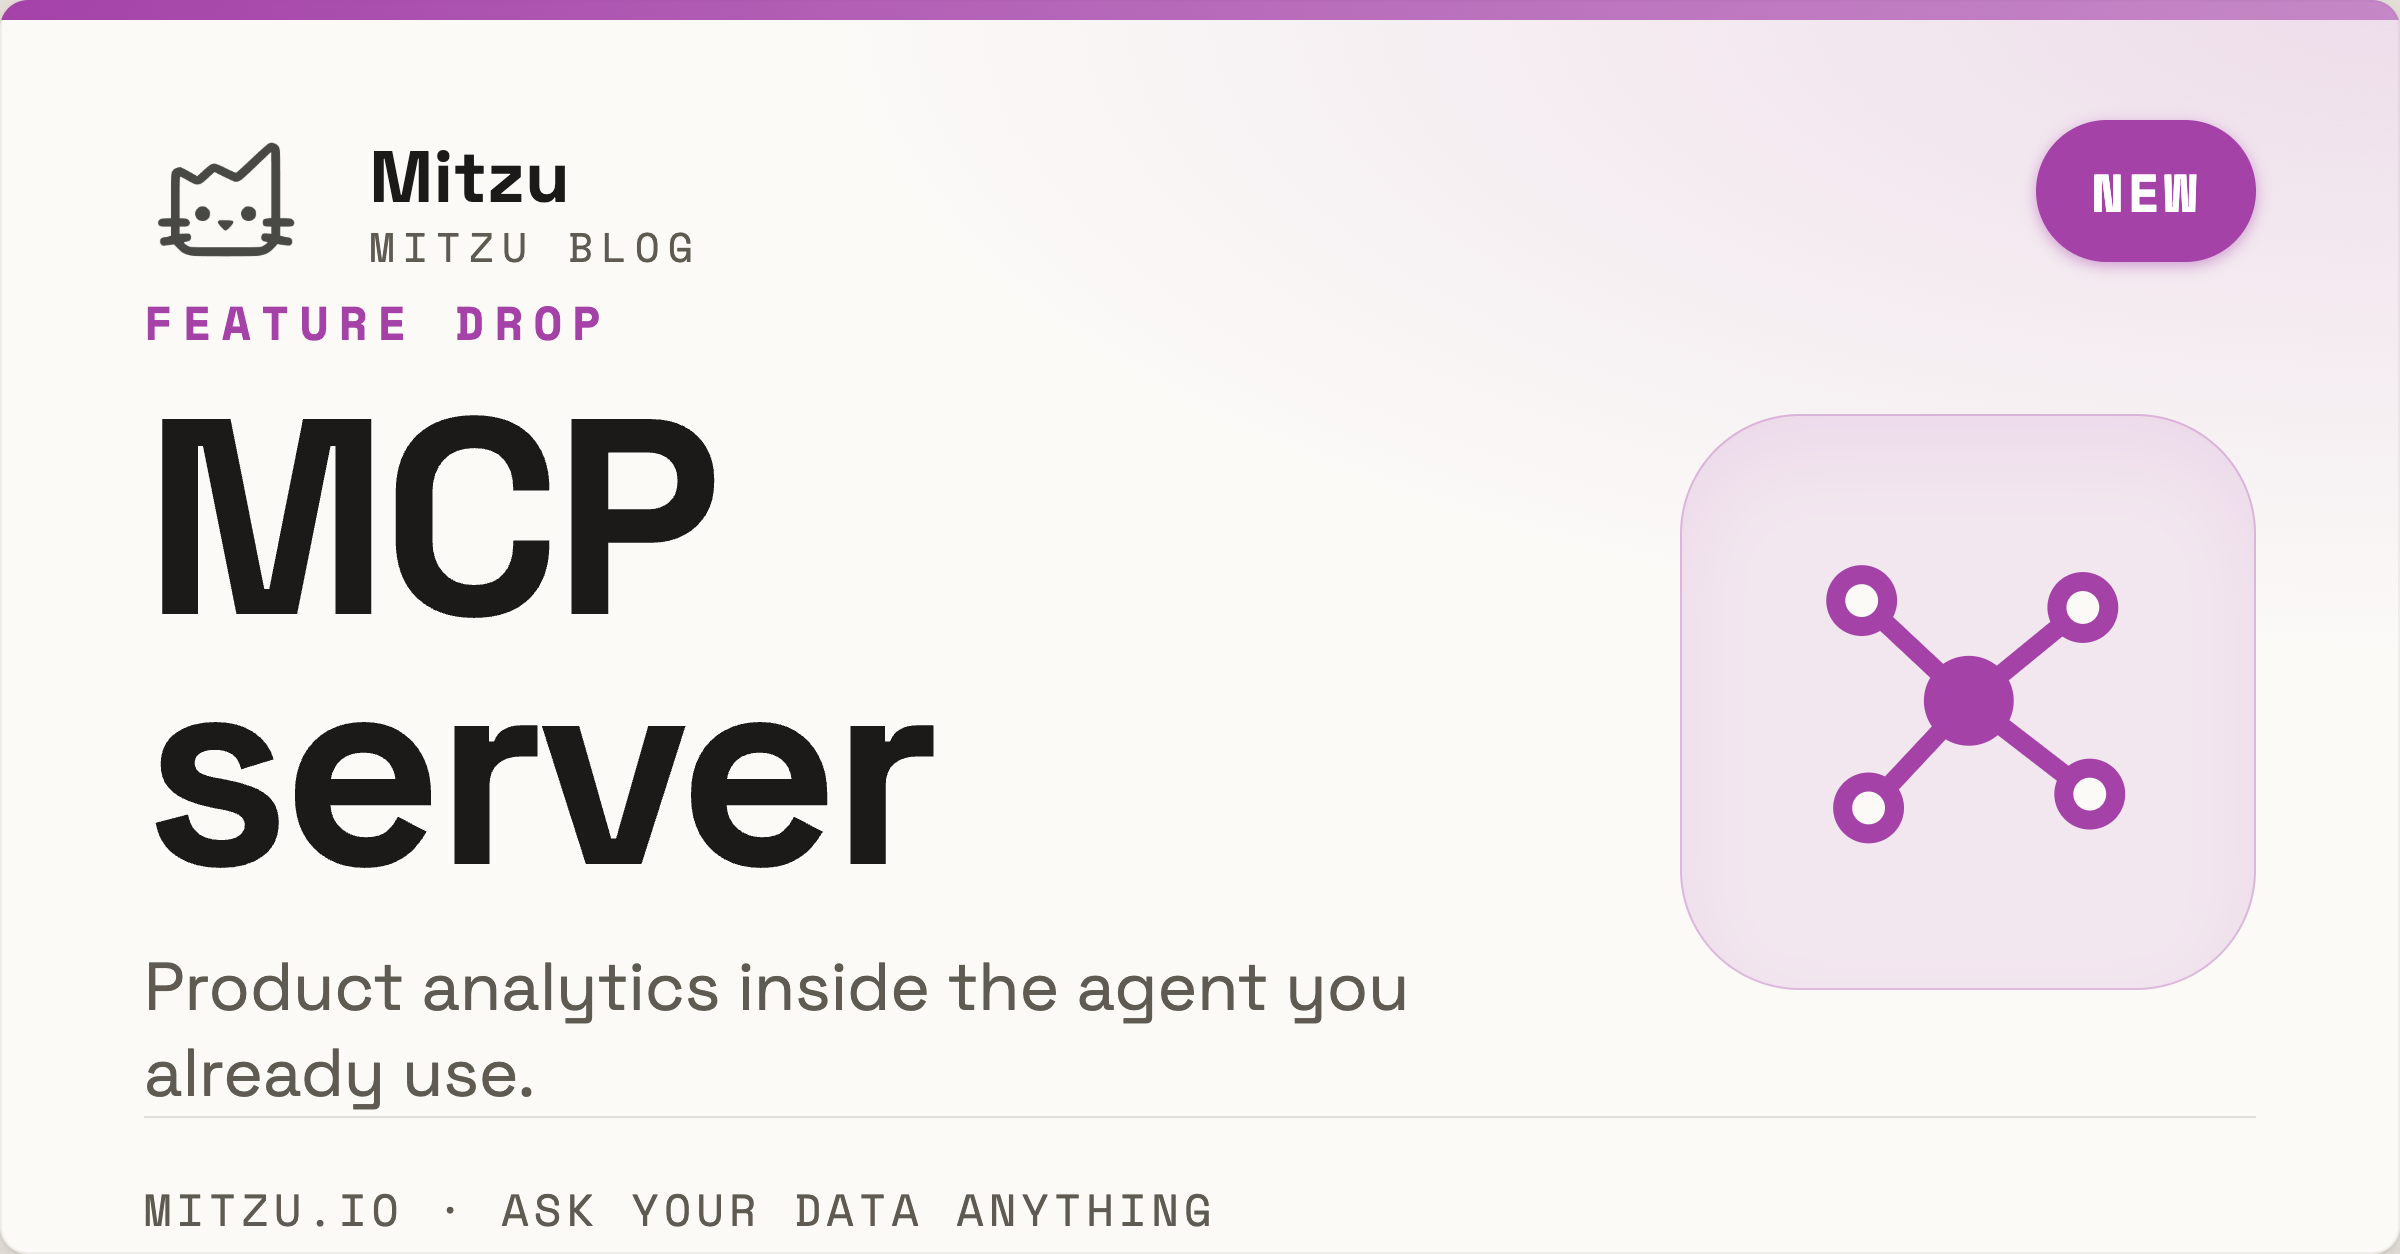
- Mitzu's MCP Server — product analytics inside the agent you already use
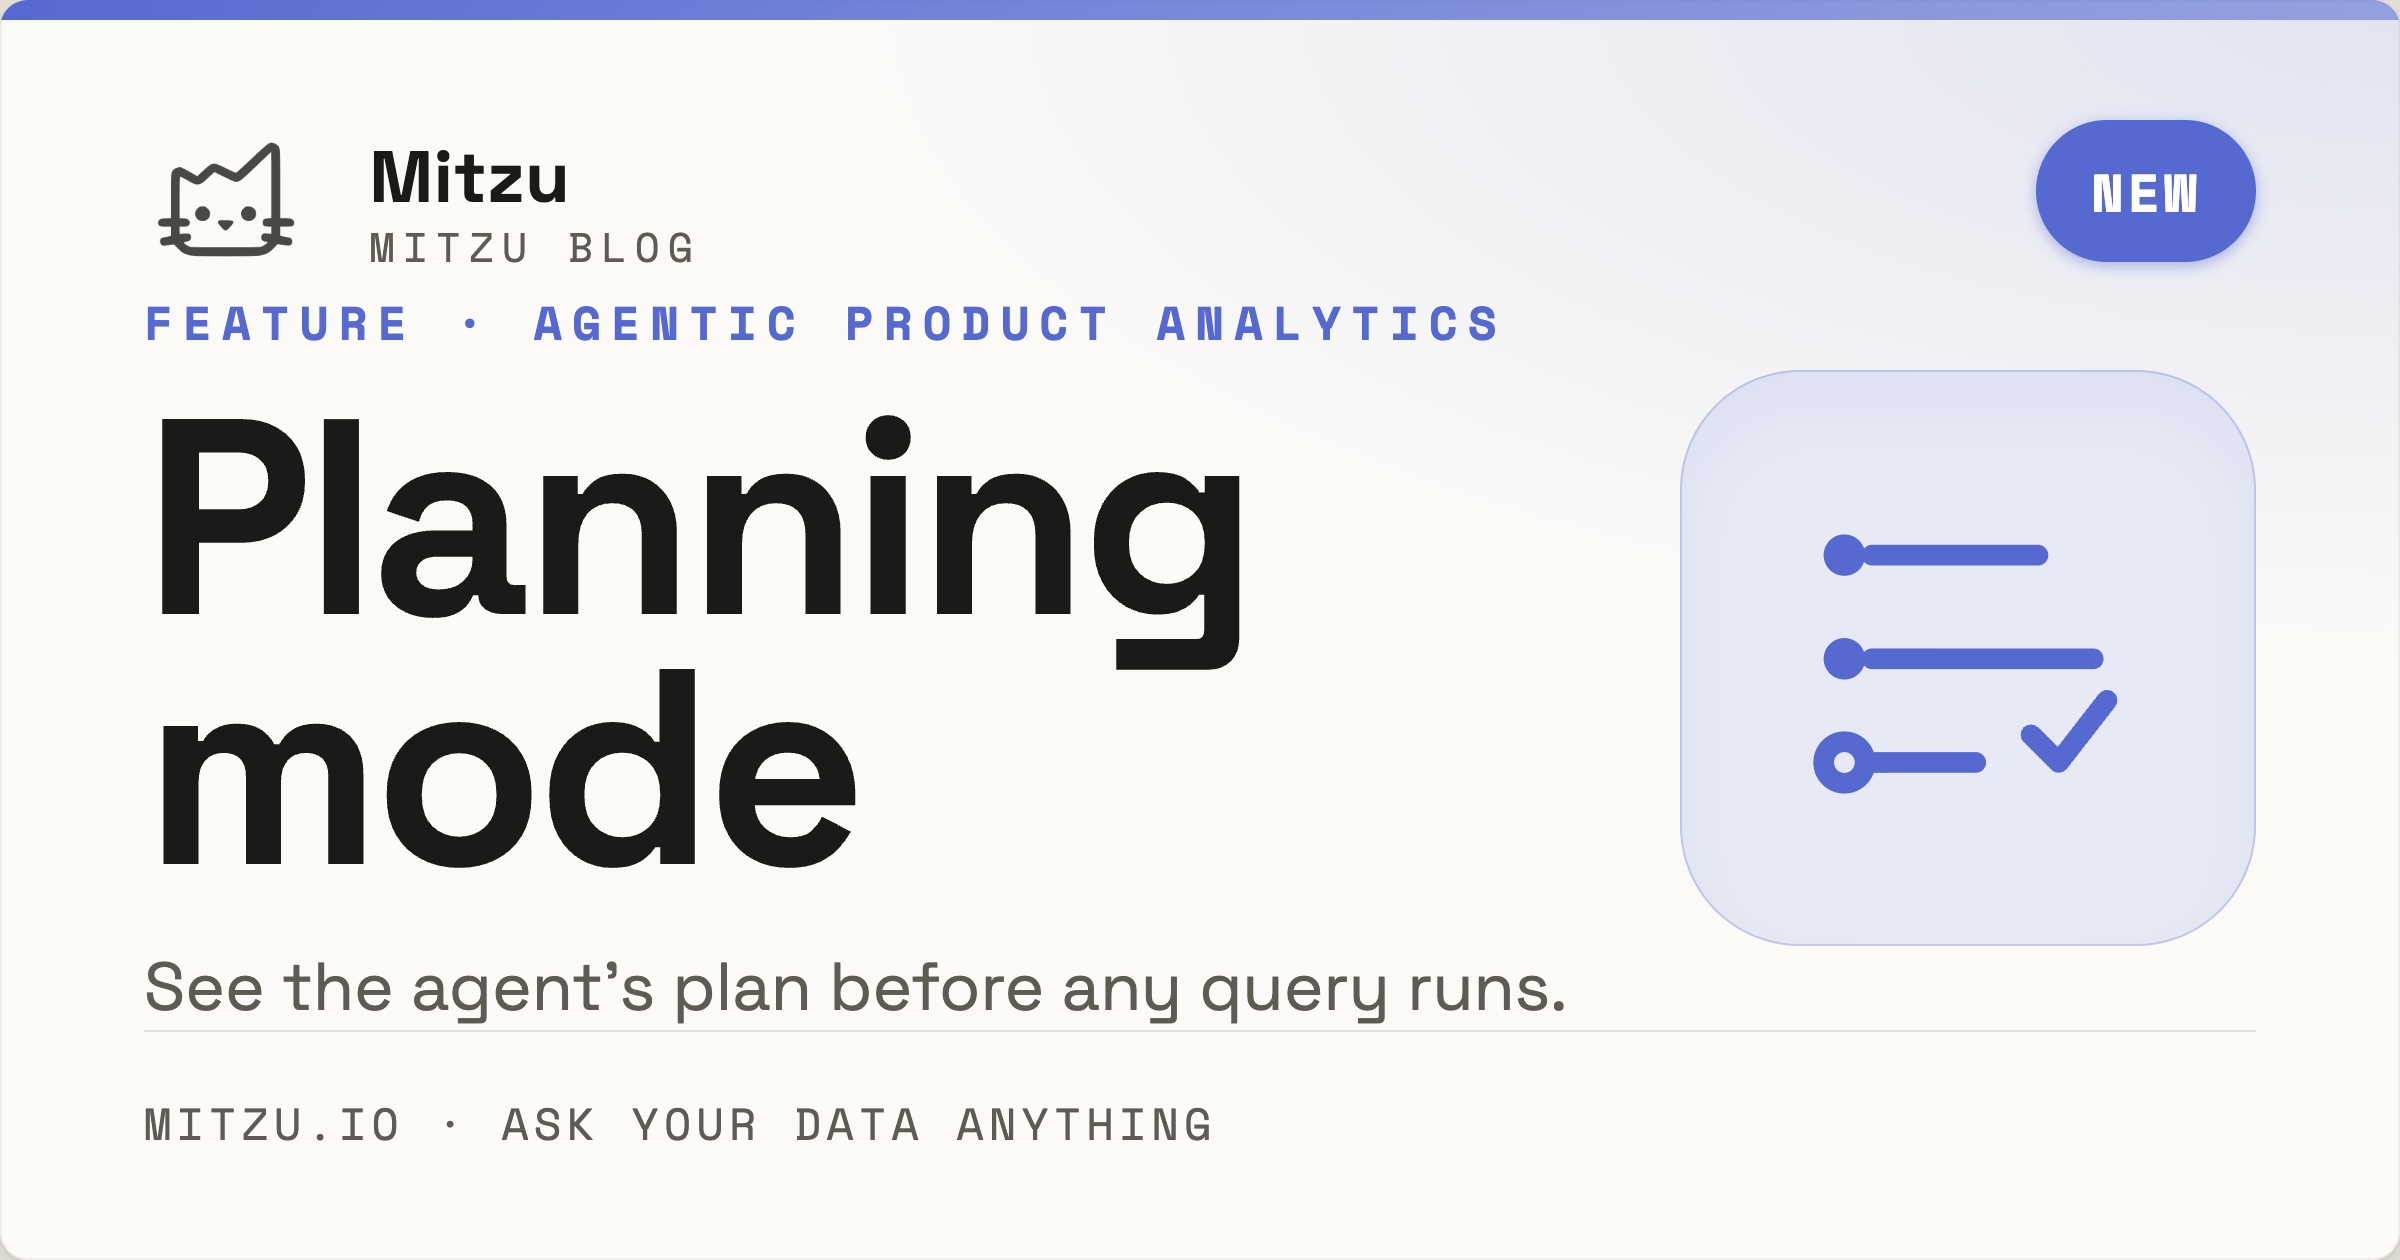
- Planning Mode — review the agent's plan before it runs
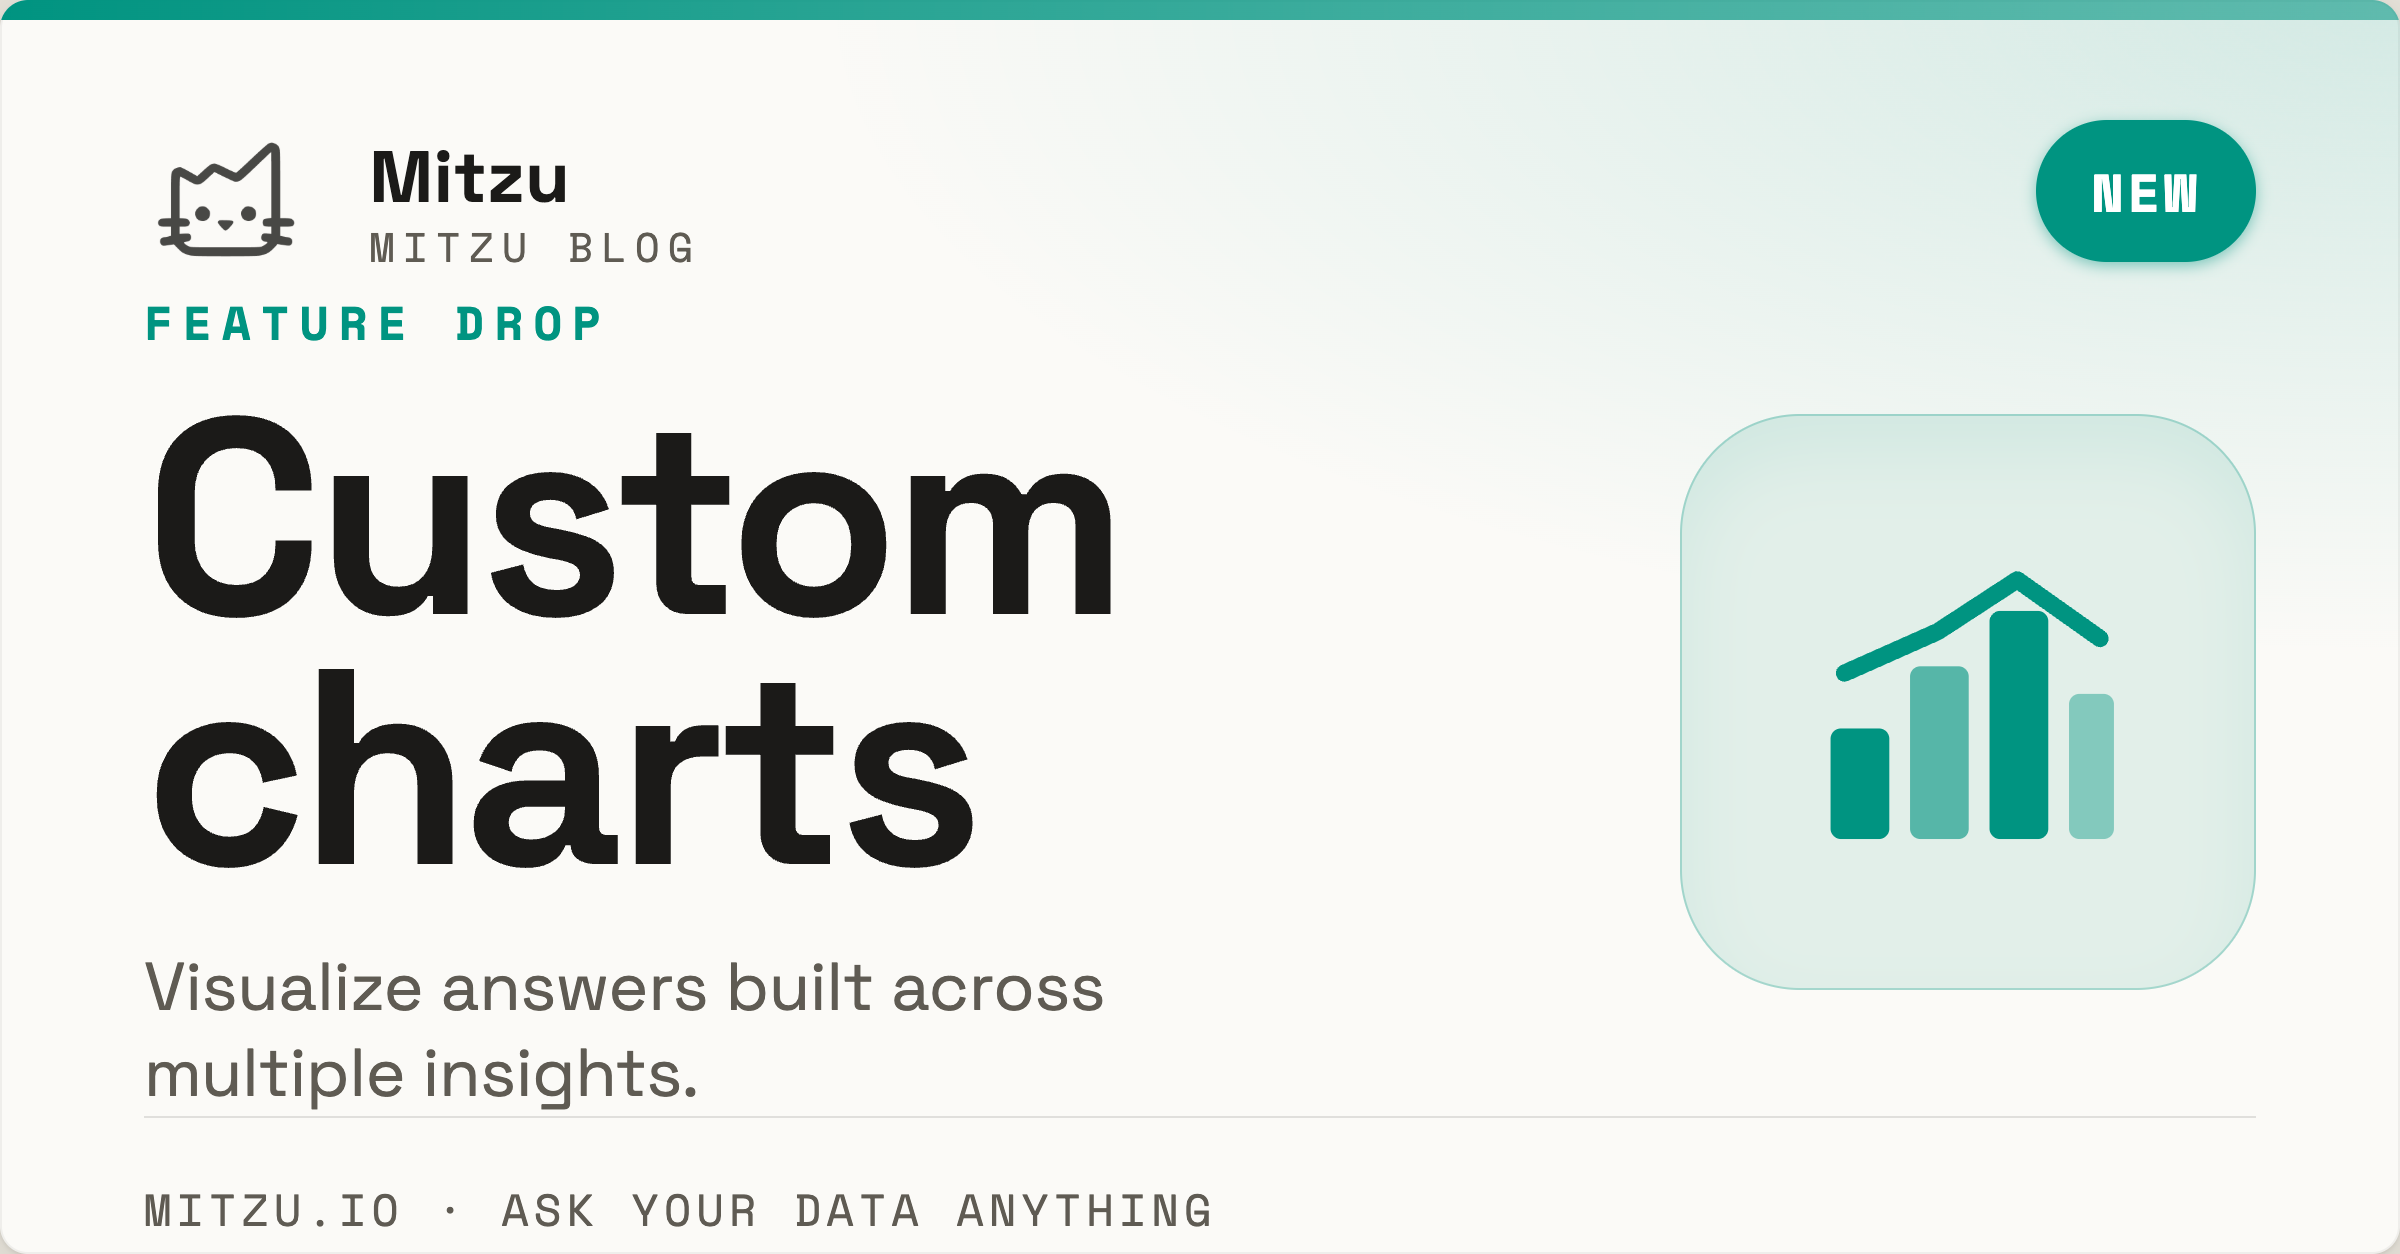
- Custom Charts — ad hoc visualizations inside the Analytics Agent
- Why agentic analytics needs a product-analytics-shaped semantic layer