TL;DR
Databricks AI/BI Dashboards is a BI tool: it charts tables, views and SQL datasets on your lakehouse, and Genie answers questions by writing SQL. Mitzu is customer journey analytics on the same Databricks warehouse. Anything with a user, visitor or account behind it (product usage, orders and revenue, marketing conversion) is computed from raw events, and every AI answer can be reviewed end to end, from plan to SQL to the users behind each number. Use AI/BI for reporting with no customer behind the row, such as finance ledgers, inventory and cloud cost; use Mitzu for every question about what customers do.
Databricks AI/BI Dashboards is a business intelligence tool: it turns tables and SQL datasets on your lakehouse into charts. Mitzu is customer journey analytics on the same Databricks warehouse: it follows every user, visitor and account through product usage, orders and marketing touchpoints, computes funnels, retention and revenue from raw events, and shows every step behind each AI answer.
Both draw charts, both build dashboards and both have an AI assistant, so they look alike in a demo. The difference shows up the first time someone asks where do new users drop off before paying, which channel converts best, and how much revenue do those customers bring? This comparison walks through that question in both tools, with tables for what is the same, what is different, how the AI works, and where each one fits. It is written for the product, growth, sales and marketing people who ask those questions, and for the analysts who set up the tools.
Business intelligence
Databricks AI/BI
AI/BI Dashboards plus Genie, built into the Databricks platform.
- Charts tables, views and custom SQL datasets
- AI-assisted authoring with Genie Code
- Genie answers questions by writing SQL
- Best for finance, inventory, cost and operations reporting
Customer journey analytics
Mitzu
Everything your users, visitors and customers do, on your Databricks event data.
- Product usage, orders, revenue and marketing conversion
- Funnels, retention, journeys and segmentation from raw events
- Agent builds an analysis specification; a deterministic engine writes the SQL
- Every AI answer reviewable end to end
What is Databricks AI/BI?
Databricks describes AI/BI as "a new type of business intelligence product" for self-service data analysis. It has two parts. AI/BI Dashboards are built from datasets (tables, views or custom SQL queries) with a library of more than 20 visualization types, global, page and widget filters, cross-filtering, drill-through, schedules, email and Slack subscriptions, and embedding. Genie is the conversational part: you ask a question in plain English, and Genie writes and runs a SQL query against the tables an author has added to a Genie space. For open-ended questions, its Agent mode drafts a research plan and runs several queries.
It is a strong choice for reporting where there is no customer behind the row: general ledger and P&L, inventory, cloud and warehouse cost, SLAs, and any table an analyst has already modelled. It needs no separate BI licence or data extract, and it inherits Unity Catalog permissions. If your question can be answered by grouping and summing columns in a table, AI/BI Dashboards will chart it well.
What is Mitzu?
Mitzu is customer journey analytics that runs on your data warehouse. It answers questions about what your users, visitors and customers do, from first visit to first order to renewal, through natural-language conversation or a no-code builder, without writing SQL. It needs one thing up front: product, sales or marketing events already in your warehouse (from Segment, Snowplow, RudderStack, Firebase, GA4, Stripe or your own pipeline). Mitzu connects to a Databricks SQL warehouse on AWS, Azure or GCP and reads the event tables in place.
At setup, the Configuration Agent scans your warehouse, finds event and dimension tables, and builds a semantic layer of events, properties and customer attributes. An analyst reviews it. From then on, product, sales and marketing teams work with four kinds of analysis: funnels, retention, segmentation and journeys. They can build them in a no-code builder or ask the Analytics Agent, in the app, in Slack, or from any MCP-connected assistant.
Where Databricks AI/BI and Mitzu overlap?
The overlap is real, and it is why the two get compared. Both are warehouse-native in the plain sense: the data stays in Databricks and the queries run on your SQL warehouse.
| Capability | Databricks AI/BI | Mitzu |
|---|---|---|
| Where the data lives | In Databricks; queries run on a SQL warehouse | In Databricks; queries run on a SQL warehouse |
| Data copies or extracts | None required | None required |
| Charts and dashboards | 20+ chart types, filters, cross-filtering | Insight cards, dashboard-wide filters and breakdowns |
| Ask in plain English | Genie, per Genie space | Analytics Agent, across the whole semantic layer |
| See the SQL | Dataset SQL; Genie's “Show code” | SQL tab on every chart and agent answer |
| Share and schedule | Publish, embed, email and Slack subscriptions | Share links, embeds, scheduled refresh and emailed reports |
| Access control | Unity Catalog permissions | Admin, member and viewer roles; SSO |
The core difference: a chart of numbers vs an analysis of journeys
A BI tool has no idea what a user, a visitor or a journey is. It knows tables, columns and aggregations. That is not a shortcoming; it is what makes BI general enough for ledgers, inventory and cost reporting. It does mean the customer journey work has to happen somewhere else first, usually in SQL that an analyst writes. For the general case, see the difference between analytics and product analytics.
BI dashboard
A funnel chart
Plots a stage and value table that someone already aggregated in SQL.
| stage | value |
|---|---|
| Visited | 10,000 |
| Signed up | 4,000 |
| Trial | 2,500 |
| Paid | 800 |
Step order, the conversion window and who counts as converted live in the SQL dataset. The chart can't change them.
Customer journey analytics
A funnel analysis
Computed per user from raw events, in order, inside a conversion window.
- Signed up
- Started trial
- Paid
The window, step order and breakdown are settings anyone can change, and the SQL is rebuilt from them.
You can see this in the AI/BI documentation. Its funnel chart takes a step column and a value column, and the example shows already-counted stages (10,000 visited, 4,000 signed up). Its cohort chart expects pre-computed retention values, and its Sankey diagram takes stage columns and a value. These are good charts. But the hard questions (in what order, within how many days, counted per user or per account, and who dropped off) are answered in the SQL that produced the numbers, not in the chart.
| Databricks AI/BI Dashboards | Mitzu | |
|---|---|---|
| Unit of analysis | Rows in a dataset | Users, visitors, accounts or sessions over time |
| Funnel | Funnel chart of step + value columns computed in SQL | Computed from raw events: ordered steps, conversion window, per-step breakdowns |
| Conversion window | Written into the SQL dataset | A setting: "within 30 days", for the whole funnel or between steps |
| Retention | Cohort chart of pre-computed retention values | Computed: cohort event, return event, "on" or "on or after", day to year buckets |
| Journeys and paths | Sankey of stage columns and a value | Journey Sankey with drop-off nodes; explore forwards or backwards |
| Who dropped off | Build another query | Click a step: list drop-off users, show their events, save a cohort |
| Count once per… | Whatever the SQL groups by | Holding constant (same session, same subscription) and analyse by user, account or session |
Not just product events: sales, orders and marketing conversion
Customer journey analytics is not limited to clicks inside an app. The rule is simple: if a row has a user, visitor or account behind it, Mitzu can analyse it. An order, a payment, a subscription renewal, a page visit with a UTM campaign and a demo request are all events with a subject. Order value, discount and plan are event properties. Country, segment and acquisition channel are customer attributes from a dimension table.
On top of counts and unique users, Mitzu aggregates any numeric property with sum, average, median, min, max or a percentile from P75 to P99. That turns order and payment events into revenue, average order value and revenue per customer. Retention on a purchase event gives repeat purchase rate, and summing its price property gives retained revenue month over month. A funnel from a campaign visit to a payment, summing the payment amount, gives the revenue those visitors brought in.
Time-to-convert measures (average, median or any percentile) answer how long the first order takes.
| Question | Databricks AI/BI Dashboards | Mitzu |
|---|---|---|
| Revenue and orders by day, region or product | Group and sum an orders table | Sum of order value, count of orders, any breakdown |
| Average order value and revenue per customer | If the dataset has one row per order | Average, median or P90 of order value; per user or per account |
| Repeat purchase rate and retained revenue | Cohort SQL first, then a cohort chart | Retention on the purchase event; sum of price for retained revenue |
| Visit-to-signup or visit-to-checkout conversion by channel | Funnel SQL first, then a funnel chart | Funnel from the campaign visit, broken down by UTM or channel |
| Revenue from visitors a campaign brought in | Join visits to orders in SQL | Funnel from campaign visit to payment, summing the payment amount |
| Time from first visit to first order | Window functions in SQL | Median or P90 time to convert |
| MRR by plan or country | From a modelled subscriptions table | Sum of plan value on subscription events, broken down by plan or country |
| General ledger, inventory, cloud cost | Its home turf | No customer behind the row; keep it in BI |
AI capabilities compared
Both products put AI at the front. The difference is in what the AI produces. Genie's language model writes SQL, which a reviewer then checks. Mitzu's Analytics Agent never writes SQL: it assembles an analysis specification (funnel steps, conversion window, breakdown, measure), and a deterministic query engine turns it into SQL. The same specification always produces the same SQL, which is what makes the rest of the answer reviewable.
| Databricks AI/BI (Genie, Genie Code) | Mitzu AI | |
|---|---|---|
| Ask in plain English | Genie chat, per Genie space | Analytics Agent in the app, in Slack and through MCP |
| How the query is produced | An LLM writes the SQL | The agent builds a specification; a deterministic engine writes the SQL |
| Build charts and dashboards with AI | Genie Code builds visualizations from prompts | The agent creates insights, dashboards, text cards and cohorts |
| Multi-step investigations | Agent mode: research plan, several queries, report | The agent runs as many analyses as the question needs, then writes a findings summary |
| Approve the approach first | Agent mode shows its research plan | Planning mode: an editable checklist; nothing runs until you approve |
| What grounds the AI | Author-curated instructions, example SQL and trusted assets per space | Auto-built semantic layer with sampled property values, saved insights, workspace custom instructions |
| Checking accuracy | Benchmarks: test questions with reference SQL | Methodology is fixed in the engine; each answer's specification and SQL are shown |
| Runs on a schedule | Dashboard refresh schedules and subscriptions | Scheduled agents that email only when a plain-English condition is met |
| What the model sees | Governed through Unity Catalog | Aggregated results and metadata, not raw rows; your own Anthropic account on request |
Reviewing a Mitzu AI answer end to end
Once AI writes the charts, the question that matters is whether you can trust them. For a product or marketing manager, the answer cannot be “read the 80-line SQL query.” What they can check is the logic: which events, in what order, over which window, broken down by what. In Mitzu, every link between the question and the number is visible:
The planBefore anything runs
For broad questions, planning mode proposes three to seven steps grounded in your events. Untick a step, ask for a change, or approve.
The searchEach step expandable
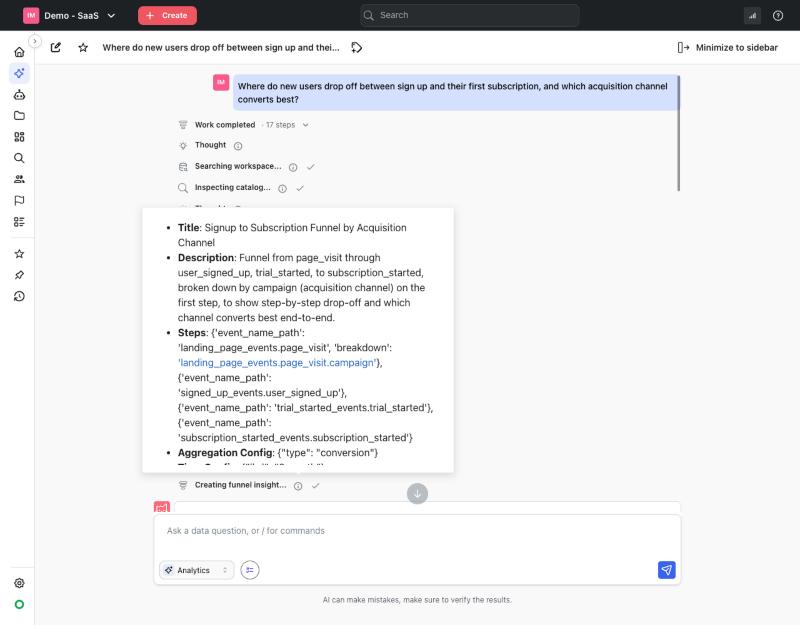
Every step the agent took (saved insights it searched, catalog entries it inspected, insights it created) is listed, with the exact inputs it used.
The specificationIn product terms
Events in order, conversion window, breakdown and measure. This is what a PM or marketer actually checks.
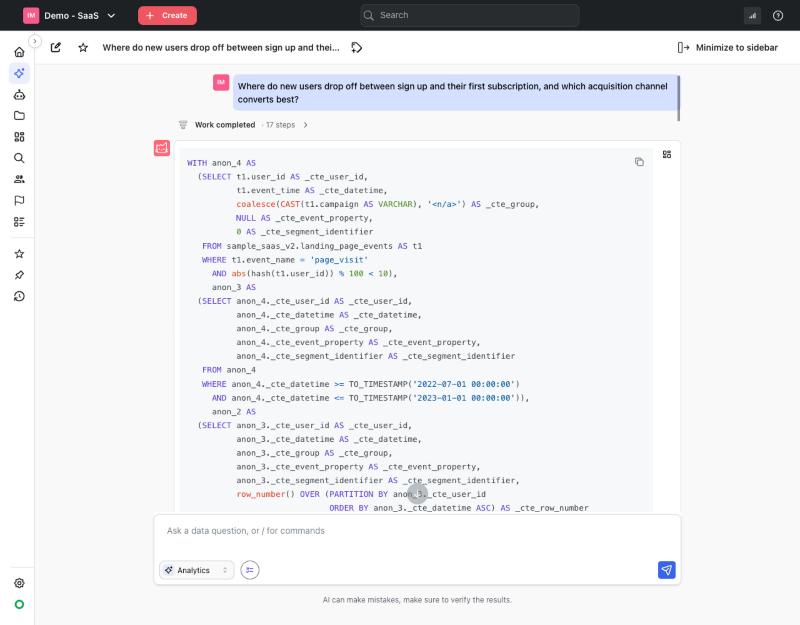
The SQLDeterministic
Generated by the engine from the specification, one click away on the SQL tab. Same specification, same SQL, every time.
The resultChart and table
Chart and table tabs, with Sampled results and Cached results badges when they apply.
The people behind the numberDrill down
List the users behind any data point, including drop-offs, and show their raw events.
The summaryAssumptions stated
The written answer names its assumptions and caveats. Open Insight to change any setting, or save the result.
Genie gives a reviewer real tools too. Each Genie response has a “Show code” view of the generated SQL, an Analysis section explaining how Genie read the question, a Trusted label when the answer used a query or function an editor added, and buttons to give feedback or request review. Databricks is also candid that Genie, like other LLMs, can be non-deterministic and should be reviewed carefully. The review still ends in SQL: the window, the step order and the attribution a PM wants to check only exist inside a query the LLM wrote for this run.
Here is what the trail looks like for a real question in Mitzu's demo SaaS project: Where do new users drop off between sign-up and their first subscription, and which acquisition channel converts best?
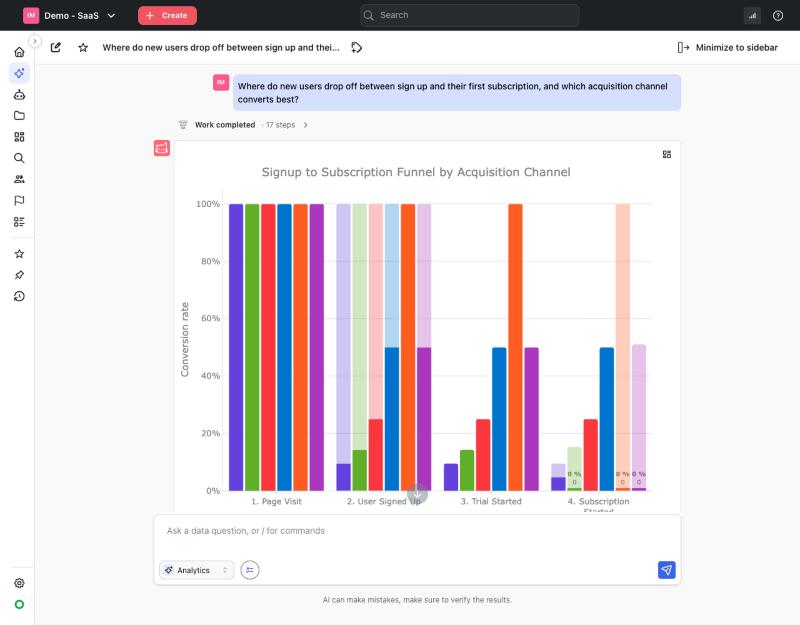
Expanding the funnel step shows exactly what was built: four events in order, a breakdown by the campaign property on the first step, and the conversion measure. The written answer also states its assumptions. Here it pointed out that the campaign is recorded on page_visit, not on the sign-up event. It also flagged that the result used 10% sampling and that some channels had only single-digit conversions.
| Databricks AI/BI (Dashboards + Genie) | Mitzu | |
|---|---|---|
| Who writes the SQL | The dashboard author, or Genie's LLM | A deterministic engine, from the analysis specification |
| Same question, same SQL | Genie can be non-deterministic; Trusted answers match curated queries | The same specification always produces the same SQL |
| What a non-SQL reviewer can check | Genie's Analysis summary of how it read the question | The plan, each step's inputs and the specification: events, order, window, breakdown, measure |
| Fix a wrong answer | Rephrase, use “Fix it”, or ask an editor to add instructions | Open the insight and change the step, window or filter |
| See the SQL | Dataset SQL and “Show code” | SQL tab on every chart |
| Check the people behind a number | Drill-through to another page or dataset | List users and show their raw events from any data point |
Self-service: who can change the question?
Self-service is not about who can look at a dashboard. Both tools do that well. It is about who can change the question when the first answer raises a second one: a 7-day window instead of 30, trial users only, revenue instead of conversion, broken down by plan instead of channel.
In AI/BI Dashboards, the logic lives in the dataset. Creating a dashboard needs the Databricks SQL entitlement and CAN USE access on a SQL warehouse, and datasets are SQL queries or tables. Viewers can filter, cross-filter and change any parameters the author exposed, such as the length of a conversion window. Authors can also add calculated fields without touching the dataset query.
A change the author did not anticipate, like a new step, a different step order or counting per account instead of per user, means editing SQL, or asking Genie and reviewing the new SQL it writes. For most PMs and marketers, that means a request to the data team.
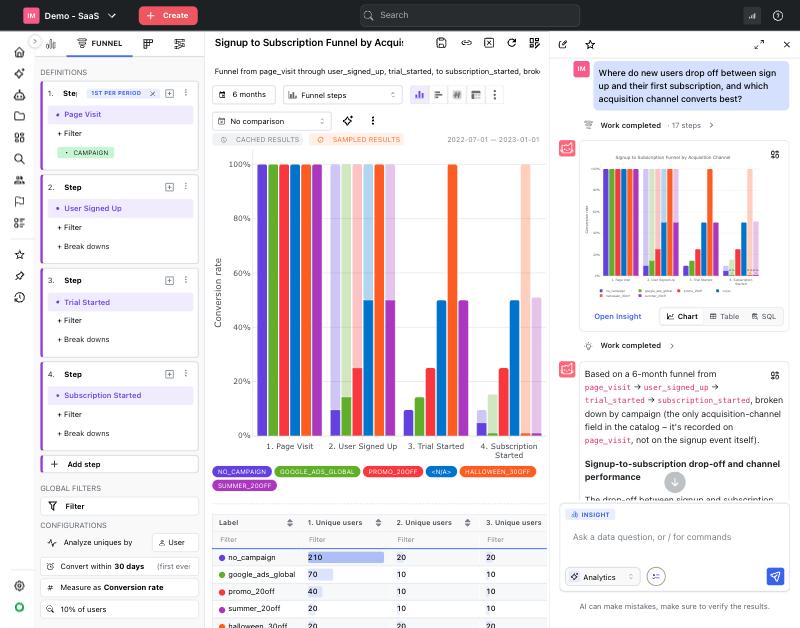
In Mitzu, every agent answer has an Open Insight link. It opens the same funnel in the no-code builder, with the agent still alongside. Steps, filters, breakdowns, “Convert within 30 days”, “Analyze uniques by User” and the sampling rate are controls on the left. Anyone can change them and the engine regenerates the SQL. They can also ask the agent to do it.
| Databricks AI/BI | Mitzu | |
|---|---|---|
| Build a new chart | Define a SQL dataset, then configure the widget, or ask Genie Code | Pick events in a no-code builder, or ask the agent |
| Change a funnel's window or step order | Edit the dataset SQL, unless the author exposed it as a parameter | Change a setting |
| Switch from conversion rate to revenue | A new dataset or calculated field | Change the measure to sum of order value |
| Follow-up questions | Genie, within the tables of its Genie space | The agent, across all events, properties and saved insights |
| Turn a drop-off into an audience | Write a query | Create a cohort from any funnel step or journey node |
| Who sets it up | Authors with SQL skills curate datasets and Genie spaces | The Configuration Agent builds the semantic layer; an analyst reviews it |
One journey question, three ways
Take the question from the review example: Where do new users drop off between sign-up and their first subscription, and which acquisition channel converts best?
AI/BI Dashboards
Write the funnel, then chart it
- An analyst writes SQL that orders each user's events, applies a conversion window, joins the channel and counts each stage
- The result feeds a funnel chart with a channel filter
- Viewers can change exposed parameters and filters; any other change means editing the dataset
Genie
Ask, then check the SQL
- Genie writes the SQL for this run
- The window, step order and channel join are the LLM's choices unless an editor added a matching example
- A reviewer checks “Show code” and the Analysis section
Mitzu
Ask, then check every step
- The agent finds the events and builds a funnel specification
- The engine computes it per user with a 30-day window, by campaign
- Review the steps, specification and SQL; Open Insight to change a setting; click a step to see who dropped off
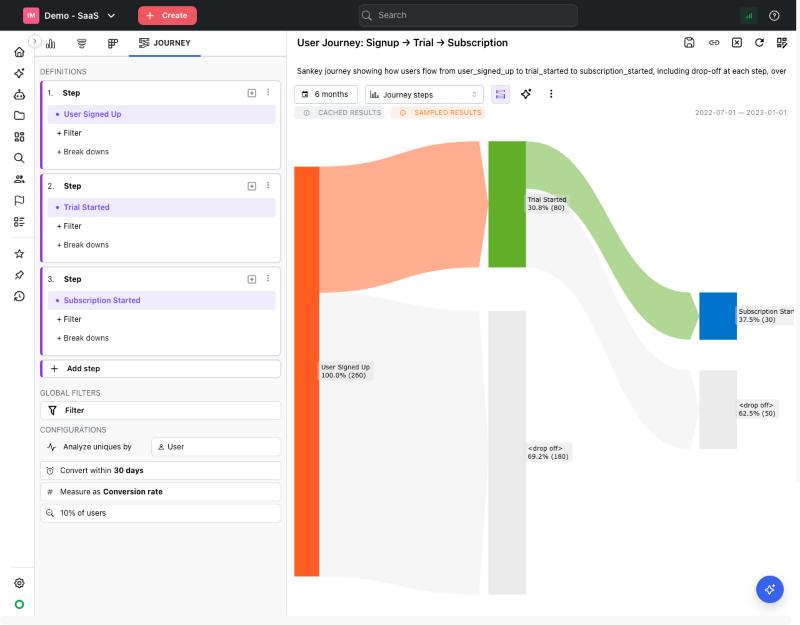
In Mitzu's demo project, the answer also flagged that the paid and seasonal campaigns converted no trials to paid in the window, and suggested the next questions to ask. A follow-up question (“show this as a journey, including where users drop off”) returned a Sankey with an explicit drop-off node after each step. A third (“how much subscription revenue did each campaign bring in?”) only needs a different measure on the same funnel.
Which questions go where?
| Question | AI/BI Dashboards | Genie | Mitzu |
|---|---|---|---|
| “Revenue by region this quarter” | Sum of order value by region | ||
| “Average order value: first-time vs repeat buyers” | Needs buyer-sequence SQL | LLM writes the sequence logic | Nth-event filter on the order event |
| “Visit-to-checkout conversion by campaign, 7-day window” | Needs a SQL dataset first | LLM writes the window logic | Funnel with a window setting |
| “Why did week-2 retention drop in March?” | Shows the drop, not the cause | Agent mode plans an investigation and runs several LLM-written queries | Agent investigates across cohorts and breakdowns |
| “After a failed payment, how many users retry, downgrade or churn?” | Needs path SQL first | LLM writes the path logic | Journey with drop-off at each step |
| “Export users who started checkout but didn't finish” | Write a query | Write a query | List drop-off users or save a cohort |
| “Warehouse cost by team” | No customer behind the row |
When to use Databricks AI/BI, Mitzu, or both?
Choose Databricks AI/BI for
Reporting with no customer behind the row
- General ledger, P&L and reconciled finance
- Inventory, cloud cost and operations KPIs
- Dashboards over modelled tables and metric views
- Teams that already write SQL in Databricks
Choose Mitzu for
Everything your customers do
- Product usage: funnels, retention, journeys and cohorts
- Sales and orders: revenue, AOV, repeat purchase, revenue per customer
- Marketing: campaign and channel conversion, and the revenue it drives
- AI answers a PM or marketer can review end to end
Setting up Mitzu on Databricks
- Connect a Databricks SQL warehouse (serverless or Pro recommended) with its host, HTTP path and catalog. See the Databricks connection guide.
- Let the Configuration Agent scan your event tables. It recognises common Segment, Snowplow, Firebase and GA4 schemas and maps users, accounts and dimension tables. Order and payment tables join the same way.
- Review the semantic layer: event names, descriptions and which properties are visible.
- Invite product, sales and marketing teammates. Pricing is per editor seat, not per event, and viewers don't take a seat.
For a longer walkthrough, read Mitzu and Databricks in practice, or compare options in the top Databricks tools for product analytics.
FAQ
What are the limitations of a Databricks dashboard?
AI/BI dashboards chart datasets. Authors can add calculated fields without editing the dataset query and expose parameters, such as a window length, that viewers change at runtime. Journey logic the author has not built in (funnel step order, per-user conversion windows, retention cohorts, paths) still has to be written in the dataset SQL first. Viewers can filter and change exposed parameters, but not the logic behind them.
Is Databricks AI/BI a customer journey analytics tool?
No. Databricks describes AI/BI as a business intelligence product. It can show journey metrics once they are computed, and it has funnel, cohort and Sankey charts, but these chart values from a dataset rather than following users through their events.
Can Mitzu analyse sales, orders and revenue?
Yes, whenever a user, visitor or account is behind the row. Orders, payments and subscription events become revenue, average order value, repeat purchase rate and revenue per customer, broken down by any customer attribute or campaign. Ledger-level finance and anything without a customer subject belong in BI.
Can I review how Mitzu's AI reached an answer?
Yes, end to end. You can approve the plan before it runs, expand every step the agent took with its inputs, read the analysis specification, open the SQL the deterministic engine generated, list the users behind any number, and open the insight in the no-code builder to change it.
Can Databricks AI/BI Dashboards build a funnel?
It can display one. The funnel chart takes a step column and a value column, so the counts per step, the step order and any conversion window have to be calculated in the SQL dataset. Mitzu calculates the funnel itself from event data, with the window and order as settings.
Does Mitzu replace Databricks AI/BI?
For customer questions, largely yes: product, sales and marketing questions with a user behind them are what Mitzu is built for. Mitzu is not a BI tool, though, and does not cover ledgers, inventory or cost reporting. The usual setup keeps AI/BI for those and uses Mitzu for everything customers do.
Does Mitzu copy data out of Databricks?
No. Mitzu runs its queries on your Databricks SQL warehouse and reads event tables in place. The AI agent only receives aggregated results and metadata, not raw rows, and your data is not used for model training.
How is Mitzu different from Databricks Genie?
Genie's LLM writes SQL against the tables in a Genie space. Mitzu's agent never writes SQL. It builds a funnel, retention, segmentation or journey specification, and a deterministic engine generates the SQL. That is why every Mitzu answer can be reviewed end to end and opens as an editable insight.