TL;DR
Discover SQL-free cohort retention analytics with Mitzu, enabling businesses to track retention and make data-driven growth decisions easily. As a Marketing manager, I know that retention is crucial for success when analyzing campaigns.
Understanding Cohort Retention: Key to Marketing Success
As a Marketing manager, I know that retention is crucial for success when analyzing campaigns. However, to leverage the data and understand our customers over a period of time, we have to stay informed about our user behaviour. Imagine you are developing a Notion-like app where you measure users who sign up for your product and engage with specific features. This user engagement generates events that are ingested into a data warehouse. In this blog post, I'll demonstrate how to analyze cohort retention for your company by comparing three possible options.
What Is Cohort Retention?
But first, let me explain what cohort retention analysis is. Cohort analysis enables us to examine groups of users who share similar traits or experiences over a specific timeframe. In this case, we created a cohort of users who signed up for the platform, and by tracking their activity, we can measure their retention and churn rate. To calculate the cohort retention rate, it is NOT enough to divide the number of users who signed up and the number of users who engaged with the features in the application.
This would result in incorrect retention rates.
Instead, you must keep track of the same users who signed up and were active in the upcoming weeks after signing up. Your product may have active users that are not from the monitored cohorts. These users we should exclude from the calculation.
Tools for Measuring Cohort Retention Rates
Now that we know how to calculate it from the data, the question is: where is the data, and how can we use it to display the retention rate? I’d like to present three cohort analysis tools for you to consider, and you can decide which one would be the best fit for your company:
SQL Queries: Flexibility with Complexity
While SQL written by data analysts offers flexibility and allows for custom queries directly in your data warehouse, it often comes with notable drawbacks.First, the process can be slow and requires skilled data analysts who know how to write complex SQL queries - something that's not easy to find.
Even with the right talent, maintaining these queries can feel like a never-ending chore, often leading to frustration. When it comes to creating visualizations, it’s a whole different headache. Whenever you want to use something or explore your data from a new angle, you’re back to writing new queries and hoping you didn’t make any mistakes along the way. It can be a real hassle!
Third-Party Tools: Quick Insights with Data Management Challenges
Using Third-party tools like Amplitude and Mixpanel have their perks, but they also come with some challenges. They’re fast and user-friendly, with built-in visualizations that make retention analysis really nice. However, you must copy all your data to their platform because they do not use a native data warehouse connection. These tools can get pretty expensive as your needs grow.
Keeping your data in sync is often more work than you’d expect, and you might find yourself stuck with their way of doing things, limiting your flexibility for your own analysis. Third-party tools offer powerful features but may require more time to manage data than actually analyze it. Overall, these tools are useful for quick insights, but they can become less ideal as your data becomes more complex.
Mitzu: Warehouse-Native Analytics for Efficient Retention Analysis
Our solution is quick, doesn’t require data copying, and has a budget-friendly seat-based pricing model. I will explain the warehouse native cohort retention calculation in the following paragraphs.
Step-by-Step Guide to Cohort Retention Analysis with Mitzu
Defining Your Cohort Group for Targeted Analysis
To start our cohort retention analysis, we must define how we'll group the users. For this example, we’re focusing on users who signed up and used the platform between November 1, 2022, and December 31, 2022.
This timeframe is crucial because it allows us to measure weekly engagement changes. We want to see how many of these new users return in the following weeks -week 2, week 3, week 4, and so on.
By measuring this, we can determine whether we’re keeping users engaged after their initial sign-up or losing them along the way. This insight will help us identify trends and areas for improvement to enhance user retention.
Tracking Customer Cohorts Over Time
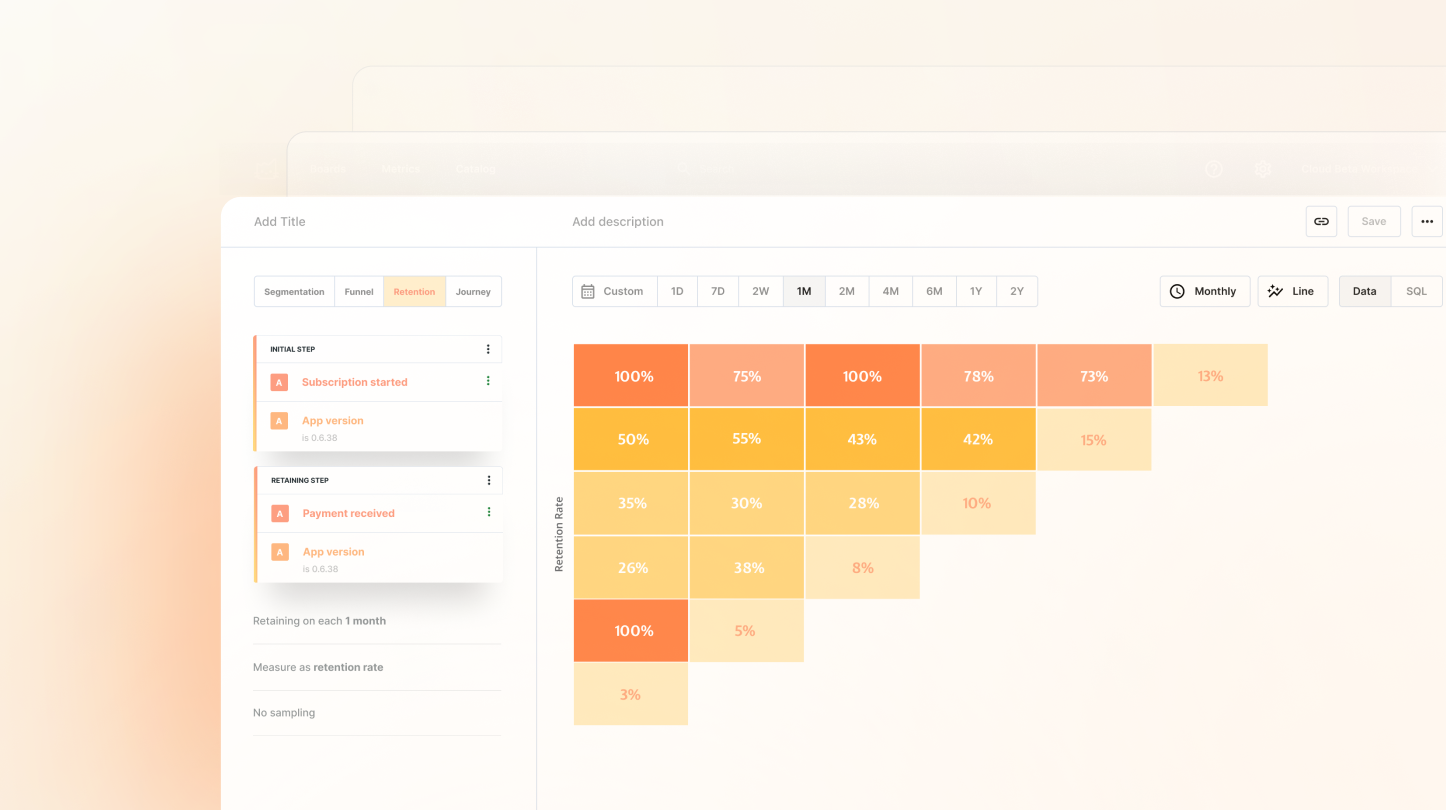
Once you've defined your cohorts, it's time to track user activity and measure retention. You want to see how many users stay active in the weeks after they first engage with your platform. I'll look at retention rates from week 0 (when they started) all the way to week 8.
Here's where Mitzu shines as a warehouse native tool. You don't need to write any complex SQL queries or copy data from an external warehouse. Mitzu automatically generates SQL queries on top of your tables. It requires no data modeling and can work on raw datasets.
It makes calculating cohort retention rates in just seconds - just select your cohort group and the timeframe you want to analyze. This help you to identify trends and patterns into user behavior without the headache of manual data crunching, writing SQLs or copying the data from the outsourced warehouse tool.
WITH `anon_3` AS
  (SELECT t1.user_id AS `_cte_user_id`,
        datetime(t1.event_time) AS `_cte_datetime`,
        CAST(NULL AS STRING) AS `_cte_group`,
        NULL AS `_cte_event_property`
   FROM `sample_saas`.`signed_up_events` AS `t1`
   WHERE t1.event_name = 'user_signed_up'),
   `anon_1` AS
  (SELECT `anon_3`.`_cte_user_id` AS `_cte_user_id`,
        `anon_3`.`_cte_datetime` AS `_cte_datetime`,
        `anon_3`.`_cte_group` AS `_cte_group`,
        `anon_3`.`_cte_event_property` AS `_cte_event_property`
   FROM `anon_3`
   WHERE `anon_3`.`_cte_datetime` >= TIMESTAMP_TRUNC(DATETIME '2022-11-01 00:00:00', ISOWEEK)
   AND `anon_3`.`_cte_datetime` = TIMESTAMP_TRUNC(DATETIME '2022-11-01 00:00:00', ISOWEEK)
   AND `anon_5`.`_cte_datetime`  datetime_add(`anon_1`.`_cte_datetime`, interval ret_3921._ret_index WEEK)
AND `anon_2`.`_cte_datetime` <= datetime_add(`anon_1`.`_cte_datetime`, interval ret_3921._ret_index WEEK) + interval '1' WEEK
GROUP BY 1,
       2,
       3

