Transforming Product Analytics With Databricks And Mitzu
Understanding user behavior is a critical component in the world of Software as a Service (SaaS), particularly in B2C contexts. The ability to analyze and interpret billions of user events can spell the difference between a stagnant product and an ever-evolving, user-centric service.
Recently, I had the opportunity to address a complex product analytics problem involving the management and processing of a staggering 8 billion user events over a two-year period, generated by a leading B2C SaaS CAD company’s application.
The primary problem was that access to relevant insights from this amount of data was sluggish at best. Answering some simple questions for product team often took hours or even days.
Processing An Ocean Of Events
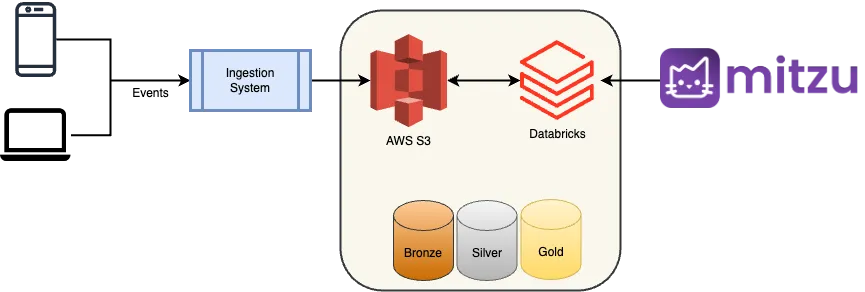
The data was streamed to an AWS S3 data lake in JSON-line files. Each file represented 15 minutes’ worth of application usage data and was methodically organized into distinct date partitions. This system allowed for daily iterative handling of the data.
Example for events stored in JSON-line files:
Event properties were compactly stored in a single flat JSON object. These properties were modelled as Spark MAP<string, string> types. This strategy allowed us to minimize the number of columns and maintain a clean data structure. In addition, it ensured the scalability of the number of events and it’s properties. The best part of this approach was that we kept every event in a single databricks table.
Daily transformations
The data processing utilized Spark SQL capabilities to generate a single delta table from the continuously ingested JSON-line files. The delta table was partitioned by the event_type column, a step that greatly enhanced query efficiency (more about this later). Data for the delta table was appended daily from the most recent “date” partition from the raw dataset. Then it was optimized and z-ordered by the event_time column, which further increased table efficiency. And finally a vacuum operation was performed to keep everything tidy on S3.
Optimizing For Usability And Maintainabilty
Scalability was an inherent feature of this project. As the data grew, our system efficiently accommodated 500 individual event types, resulting in an equivalent number of partitions in the delta table. Having only a single table ensures minimal maintenance costs. We could allocate a single data engineer part-time to keep the system up and running.
This was all possible thanks to the MAP<string, string> type. The alternative option would have been to create 500 individual tables with different schemas. It is difficult to imagine maintaining that as easily as a single table.
Of course the MAP<string, string> comes with its drawbacks. Namely, there is no strong typing of map values. However, Spark is smart enough to figure out what to cast in case there is a comparison in the SQL queries over the event property values.
We also thought of creating 3 or 4 different maps each with its own data type, however in the end it wasn’t worth doing.
Time To Insight Is The Key
As it turns out, 90% of questions product managers ask cover one to three event types and only look back six months. Most of these questions are about daily usage of certain features or user funnel questions. Some queries may be more complex such as calculating retention which requires delicate joins. In spite of that, those were still completed within a minute.
Partitioning The Data Based On Event_type And Z-Ordering By Event_time Ensured That 75% Of Ad-Hoc Analytics Queries Finished In Under 10 Seconds Over The 8 Billion Rows Of Data.
With an ever-evolving product, “time to insight” is essential. Product teams ask hundreds of questions about users and their behaviour. If they needed to wait hours for every piece of information the company’s decision making could slow down to a halt.
Scratching An Itch For Non-Tech Product People
Having data in the data lakehouse is one thing, but having it accessible for everyone, even non-tech people, is another. To ensure everyone can access product data insights, we introduced Mitzu.
Mitzu is a self-serve, no-code product analytics tool that directly queries the data warehouse. It is an open-source project developed entirely in Python and Dash.
It proved to be an invaluable tool for us. It successfully interpreted the complex delta table schema and identified variations in event properties. Mitzu essentially gave us unified access to all our usage data without ever touching the SQL editor.
Mitzu further reduced the “time to insight” for our stakeholders. With it stakeholders didn’t need to wait for data analysts to answer their questions, they could do it for themselves.
By facilitating native data warehouse querying via Databricks’ Serverless SQL the time taken to generate insights was reduced from hours or days to mere seconds.
Final Thoughts
In summary, this project represented a successful journey from a seemingly overwhelming 8 billion user events table to an easily accessible and insightful resource. This was achieved through the strategic use of Databricks features such as partitioning and z-ordering of the delta tables, and the power of analytics tools such as Mitzu.
With the emergence of the modern data stack we no longer need to move product data to external analytics tools such as Mixpanel or Amplitude. Everything can be done in place, in the data warehouse.
Extra Thoughts About Dash
Mitzu is entirely written in Dash. It is an excellent example of what can be achieved with this open-source Python library. As a result, we could develop this project completely and iterate over features extremely fast due to its simplicity. The inbuilt charting and data grid solutions allowed us to ship data visualization features in just a couple of days. This otherwise would have taken weeks or months.
Kudos to the Dash team!