TL;DR
An A/B test shows two versions to random groups of users and uses statistics to decide whether the difference in results is real or luck. A result is statistically significant when its p-value is below 0.05; use a z-test for conversion rates and a t-test for averages. Decide your sample size before the test, never stop at the first significant peek, and report the lift with its confidence interval.
A/B testing is a simple experiment. You show version A to one random group of people and version B to another, then compare how each group behaves. The statistics answer one question: is the difference real, or just luck? This guide explains every A/B testing statistics term you will meet (p-value, statistical significance, z-test, t-test, z-score and t-score, confidence interval, sample size and statistical power) in plain English, with worked examples, diagrams, and zero math anxiety 🙂.
There are no formulas to memorize. Each concept gets a one-line answer, an everyday analogy, and a worked example with real numbers, so the next experiment report you read makes sense. If your experiment data already sits in a data warehouse, the last section shows where to read the results.
The 60-second version: every A/B testing term in one table 📋
| Term | What it means in plain English | Rule of thumb |
|---|---|---|
| 🧪 A/B test | Show A and B to random groups and compare one metric | Change one thing at a time |
| 🙅 Null hypothesis | The boring assumption: A and B perform the same | The test tries to disprove it |
| 🎲 p-value | If A and B were identical, how often would luck produce a gap this big? | Smaller = more surprising |
| ✅ Statistical significance | The p-value is below the cut-off you chose (α) | α = 0.05 is the usual cut-off |
| 📏 z-score / t-score | The gap divided by its noise (the standard error) | Beyond ±1.96 ≈ significant at 95% (large samples) |
| 🛒 z-test | Compares two rates (did the user convert: yes or no) | The default for conversion rates |
| 🍪 t-test | Compares two averages per user (revenue, minutes, sessions) | Use Welch's version |
| 🎯 Confidence interval | The range of believable values for the true lift | Doesn't cross 0 → significant |
| 🚨 Type I error | False alarm: calling a winner that isn't one | Happens α of the time (5%) |
| 😴 Type II error | Missed win: B is better, the test says "no difference" | Often set to 20% (β) |
| 💪 Statistical power | The chance of catching a real effect of a given size | Aim for 80% |
| 📐 MDE | The smallest lift your test is sized to detect | Half the MDE → about 4× the users |
What is A/B testing?
A/B testing (also called split testing) is a randomized experiment that compares two versions of something, such as a web page, an app screen, an email or a price. Each version goes to a random half of your users, and you measure which one performs better on a single metric.
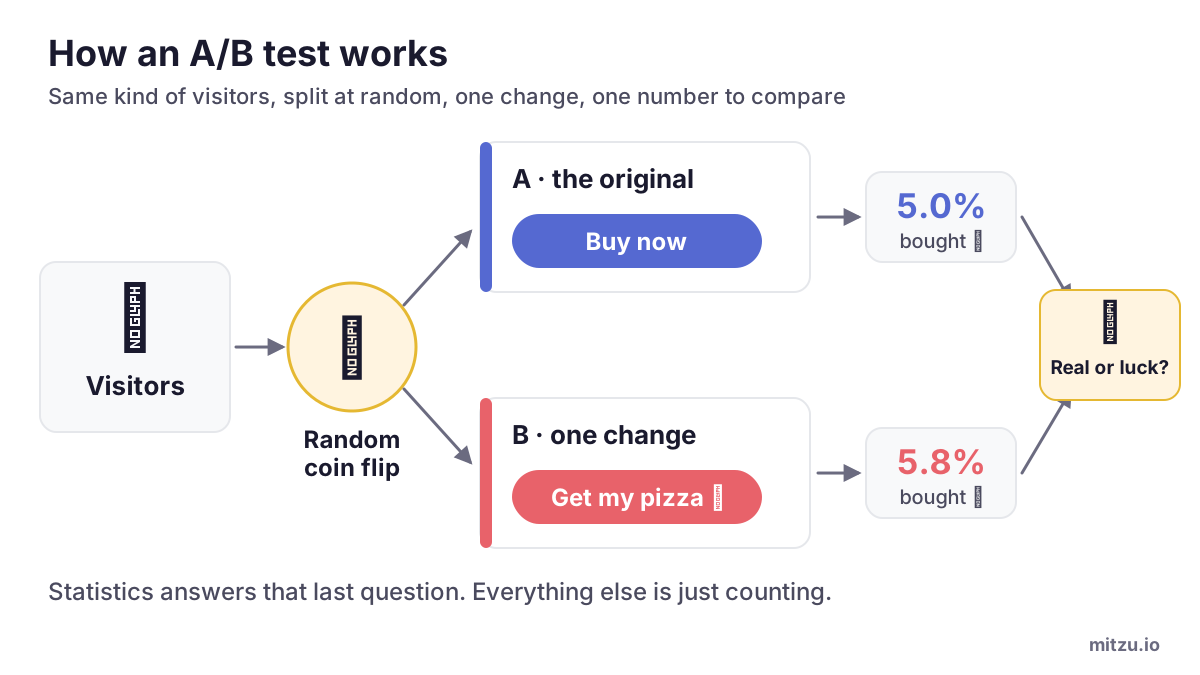
The coin flip is the key ingredient 🪙. Because users land in A or B at random, the two groups are alike in every way except the change you made: the same mix of new and returning users, the same devices, the same weekdays. So if B does better, the change is the most likely reason, not the kind of people who happened to see it.
Four A/B tests you could run on Monday:
- 🍕 Pizza shop checkout: a "Buy now" button vs a "Get my pizza" button. Metric: the share of visitors who order.
- 📧 Newsletter: two subject lines. Metric: open rate.
- 📱 App onboarding: a 5-step tour vs a 3-step tour. Metric: the share of new users still active after 7 days.
- 🛍️ Online bakery: a free-shipping banner vs no banner. Metric: revenue per visitor (visitors who buy nothing count as $0).
Some vocabulary for the rest of the guide: version A is the control (what you have today), version B is the variant (the change), and the number you judge them by is the metric. Metrics come in two flavors: a rate (what share of users did the thing, like a step in a conversion funnel) or an average (how much of it they did). That split decides which statistical test you use, as we'll see.
Why can't you just compare the two numbers?
Because every result wobbles by chance. Even if A and B were identical, their conversion rates would almost never come out exactly equal, so a small gap on its own proves nothing.
Flip a fair coin 100 times and you expect 50 heads, but you rarely get exactly 50. In the simulation below, ten batches of 100 flips of the same fair coin landed anywhere from 43 to 55 heads. Nothing changed between batches: that spread is pure noise 🎲.
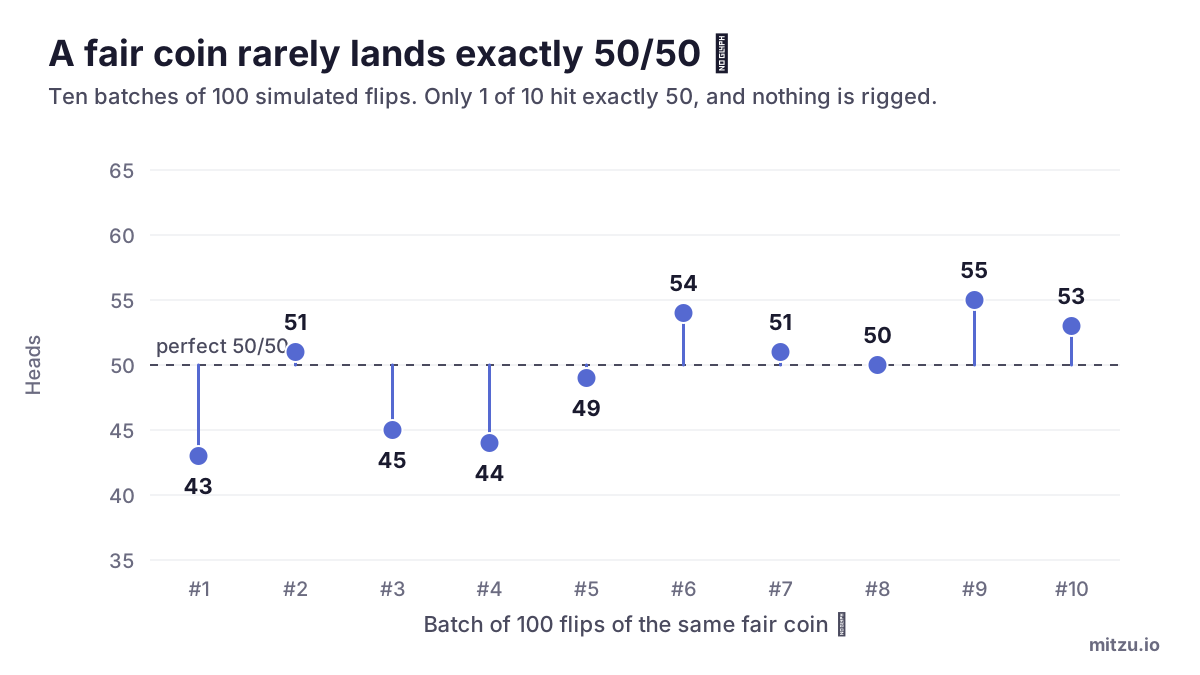
Your A/B test has the same problem. If B converts at 5.8% and A at 5.0%, statistics tells you whether that 0.8-point gap is bigger than the wobble you'd expect from luck alone. 🙂 In plain English: A/B testing statistics are a noise filter.
This is also why some teams run an A/A test first: both groups see the same version, which shows how big the natural wobble is and checks that the setup isn't broken.
What is the null hypothesis?
The null hypothesis is the boring default assumption that version B makes no difference: A and B convert at the same rate, and any gap you see is luck. The alternative hypothesis is the opposite: B does make a difference, better or worse.
⚖️ Think of a courtroom. The null hypothesis is "innocent until proven guilty", and your data is the evidence. You only reject the null hypothesis (declare that B really is different) when the evidence would be very unlikely if B were innocent. And as in court, a "not guilty" verdict doesn't prove innocence. It means there wasn't enough evidence.
What is a p-value?
A p-value is the probability of seeing a difference at least as large as the one you measured if A and B were actually identical. A small p-value means your result would be surprising in a world where the change did nothing. That's the standard statistical definition, and it's the one to remember.
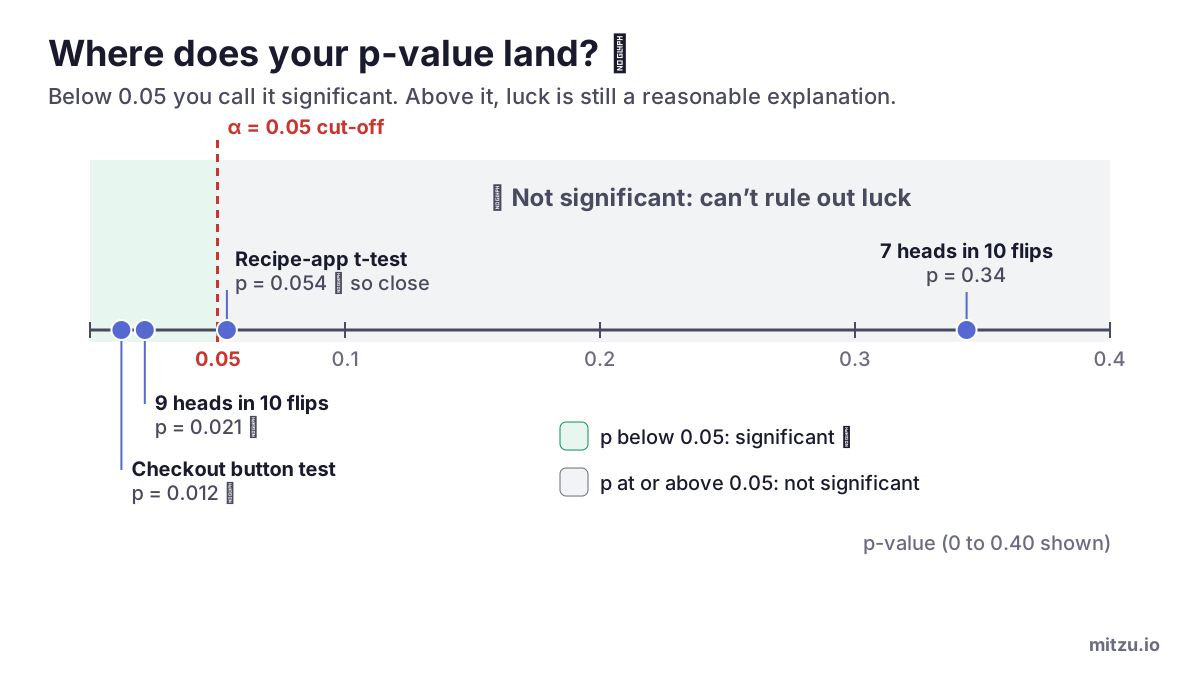
🪙 Coin example: a friend flips a coin 10 times and gets 9 heads. If the coin were fair, how often would a result be that lopsided (9 or more heads, or 9 or more tails)? Only 2.1% of the time, so p = 0.021. That's rare enough to get suspicious 🤨. Seven heads out of ten, on the other hand, happens 34% of the time with a fair coin (p = 0.34): nothing to see here.
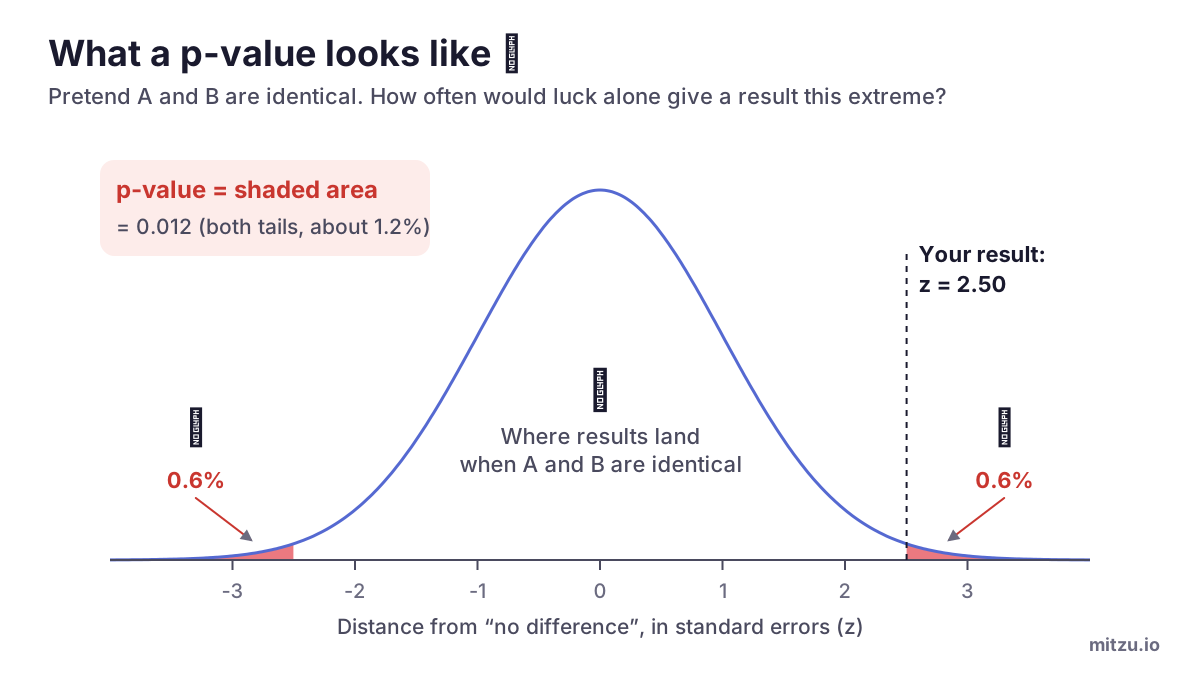
In an A/B test, the bell curve shows every gap you could get from luck alone if A and B were identical. Most land near zero (the 😴 zone). Your actual result sits somewhere on this curve, and the p-value is the area in the tails beyond it.
⚠️ What a p-value is not:
- Not the probability that B is better. p = 0.012 does not mean "98.8% chance B wins".
- Not the probability that your result is a fluke. The p-value is calculated by assuming there is no real difference, so it can't also tell you how likely that assumption is.
- Not a measure of how big or important the effect is. A tiny, useless lift can have a tiny p-value if you have millions of users.
What does statistically significant mean?
A result is statistically significant when its p-value falls below a cut-off you pick before the test, called the significance level or alpha (α). The usual cut-off is 0.05, and that's what "95% significance" or "95% confidence" means (95% = 1 − 0.05).
🚨 α is the sensitivity of your smoke alarm. Set it to 0.05 and you accept that when there's no fire (A and B are identical), the alarm still goes off about 1 time in 20. Stricter teams use 0.01 (1 false alarm in 100) and pay for it with bigger samples.
⚠️ Significant doesn't mean important. Statistical significance only means "probably not luck". It says nothing about whether the lift is big enough to matter. A 0.02-point lift can be significant with enough users and still not be worth the engineering time, so always look at the size of the effect and its confidence interval too.
What is a z-score (and a t-score)?
A z-score measures how far your result is from "no difference", counted in units of noise. It's simply signal divided by noise: the gap between A and B divided by its standard error. A t-score is the same idea, used in the t-test.
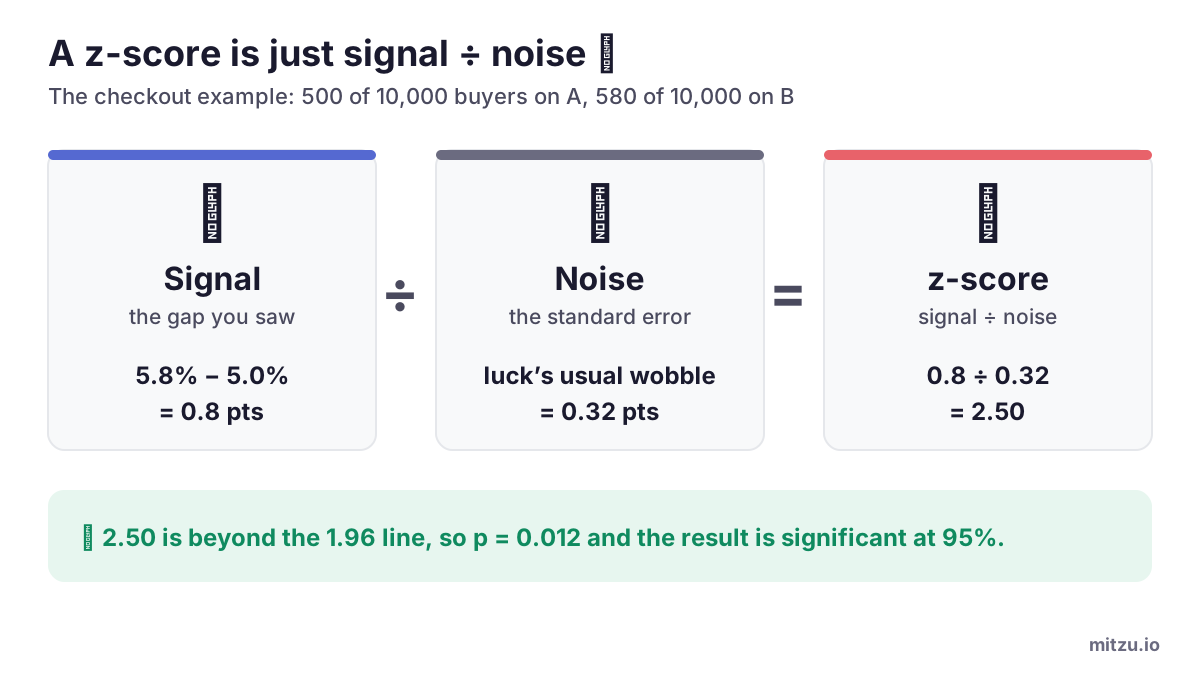
The standard error is the size of the wobble: how much the gap between A and B would jump around if you re-ran the same test many times. It shrinks as you add users, which is why bigger tests can detect smaller effects.
📏 Rule of thumb: with large samples, a z-score beyond ±1.96 means p < 0.05 (significant at 95%), and beyond ±2.58 means p < 0.01. The further from zero, the less likely luck explains the result.
What is a z-test?
A two-proportion z-test checks whether two conversion rates are really different. It's the standard test for A/B tests where each user either converts or doesn't (clicked, signed up, bought).
Worked example: the pizza checkout test 🍕
The test ran for two full weeks:
| Version | Visitors | Orders | Conversion rate |
|---|---|---|---|
| A: "Buy now" | 10,000 | 500 | 5.0% |
| B: "Get my pizza 🍕" | 10,000 | 580 | 5.8% |
- Signal: the gap is 5.8% − 5.0% = 0.8 percentage points (a 16% relative lift).
- Pooled rate: if A and B were the same, the best guess of the shared rate is (500 + 580) ÷ 20,000 = 5.4%.
- Noise (standard error): √(0.054 × 0.946 × (1/10,000 + 1/10,000)) = 0.0032, or 0.32 percentage points.
- z-score: 0.8 ÷ 0.32 = 2.50.
- p-value: a z-score of 2.50 leaves 0.6% in each tail of the bell curve, so p = 0.012 (two-sided).
- Verdict: 0.012 is below 0.05, so the new button's lift is statistically significant 🥳.
The same thing as a formula, if you want to put it in a spreadsheet:
pooled = (orders_A + orders_B) / (visitors_A + visitors_B)
SE     = sqrt( pooled * (1 - pooled) * (1/visitors_A + 1/visitors_B) )
z      = (rate_B - rate_A) / SE
p      = 2 * (1 - NORM.S.DIST(ABS(z), TRUE))      -- two-sided, Excel/Sheets
🔍 Same rates, fewer users: run the same 5.0% vs 5.8% with only 2,000 visitors per version and you get z = 1.12 and p = 0.26, which is not significant. The gap didn't change; the noise did. That's why sample size matters so much (more on that below).
What is a t-test?
A t-test compares two averages, such as revenue per visitor, minutes watched, or sessions per user. Use it when your metric is a number per user rather than a yes or no. For A/B tests, use Welch's t-test, which doesn't assume both groups have the same spread.
Worked example: the cookie-recipe app test 🍪
A cookie-recipe app tests a new bake-along video on its home screen, with only 25 new users per version. The metric is minutes spent in the app during the first week, and every assigned user counts, including anyone who spent 0 minutes:
| Version | Users | Average minutes per user | Standard deviation |
|---|---|---|---|
| A: no video | 25 | 42 min | 12 min |
| B: bake-along video | 25 | 49 min | 13 min |
- Signal: 49 − 42 = 7 minutes.
- Noise (standard error): √(12²/25 + 13²/25) = 3.54 minutes.
- t-score: 7 ÷ 3.54 = 1.98.
- Degrees of freedom (Welch): about 48.
- p-value: 0.054.
- Verdict: just above 0.05, so not significant 😬. The 7-minute lift might be real, but 25 users per version can't rule out luck. Keep the test running until you reach the sample size you planned.
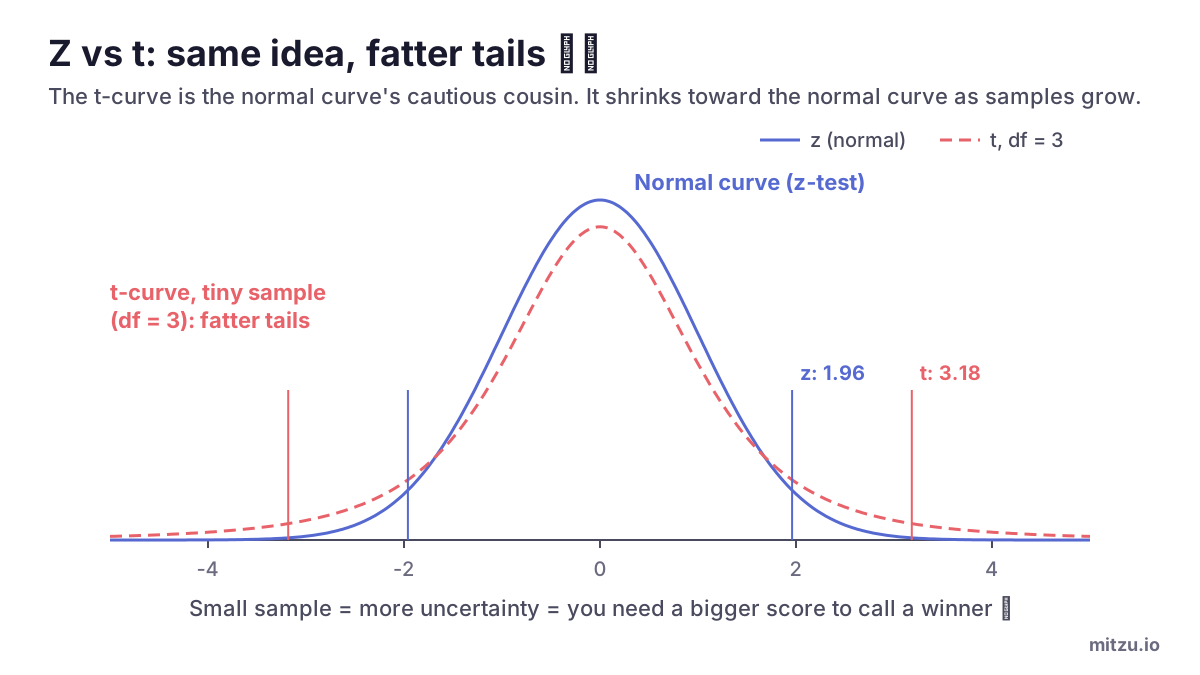
🤓 Plot twist: a t-score of 1.98 is bigger than the famous 1.96. Plug it into a z-test and you'd get p = 0.048 and a "winner". The t-test is stricter with small samples: with about 48 degrees of freedom, the cut-off is 2.01, not 1.96. That extra caution is exactly what the t-test is for.
Degrees of freedom roughly means "how much data you have to estimate the noise". Fewer users means fewer degrees of freedom, fatter tails on the curve, and a higher bar to clear.
⚠️ Careful with "average order value". It only averages the people who bought, and version B can change who buys, so the two groups are no longer comparable. Average over everyone who was randomized instead: revenue per visitor, where visitors who buy nothing count as $0.
Z-test vs t-test: which one should you use?
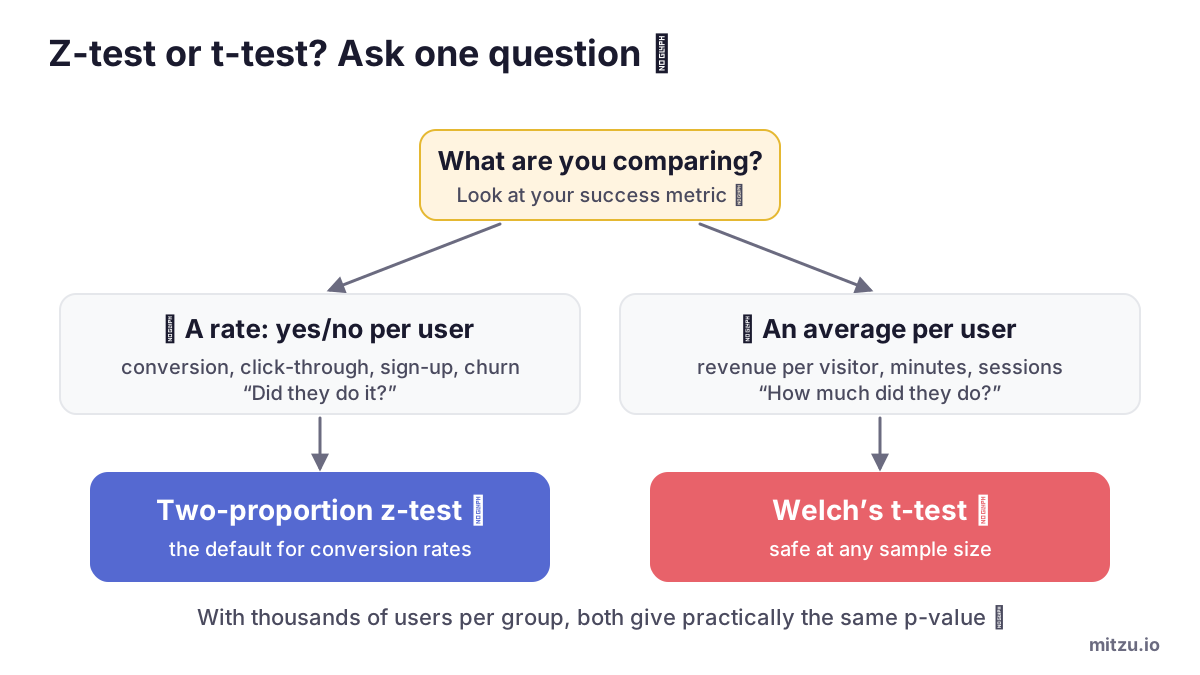
Use a z-test for conversion rates (yes/no metrics) and a t-test for averages (numbers per user). With the thousands of users a typical A/B test has, the two give practically the same answer. The choice only really matters with small samples, where the t-test is the safer, stricter option.
| Z-test | T-test | |
|---|---|---|
| Best for | Rates: conversion, click-through, sign-up | Averages: revenue per visitor, time spent, sessions |
| Noise is estimated from | The conversion rate itself | The sample's standard deviation |
| Reference curve | Normal (bell) curve | t-distribution (fatter tails) |
| Cut-off for 95%, two-sided | 1.96 | 2.57 (df 5) · 2.23 (df 10) · 2.04 (df 30) · 1.98 (df 100) |
| Small samples | Can be too optimistic | Built for them |
| Thousands of users per group | Same answer as the t-test | Same answer as the z-test |
The textbook rule, "use z when you know the population standard deviation, t when you don't", trips beginners up because in A/B testing you almost never know it. Conversion rates are the exception that makes z-tests standard: for a yes/no metric, the spread follows from the rate itself (it's p × (1 − p)), so there's nothing extra to estimate.
You may also see a chi-squared test in some tools. For a simple two-version conversion test, it gives the same p-value as the two-proportion z-test (the chi-squared statistic is just z²), so don't let the name worry you.
What is a confidence interval?
A confidence interval is the range of values the true lift could plausibly take, given your data. If a 95% confidence interval doesn't cross zero, the result is significant at the 5% level.
🍕 For the pizza test, the 95% interval for B − A is +0.17 to +1.43 percentage points. Translation: B most likely lifts conversion by somewhere between a little (0.17 points) and a lot (1.43 points), with 0.8 as the best guess. Zero isn't in the range, so we can be fairly confident B isn't worse 🥳.
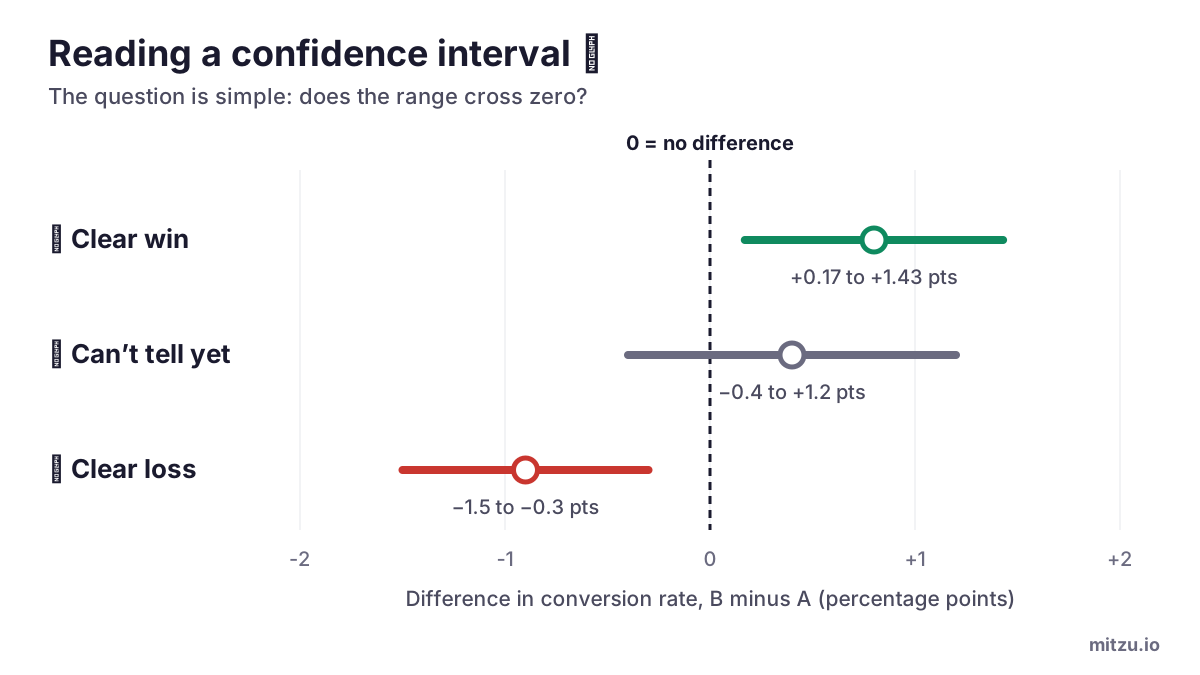
🎯 Why this beats a lone p-value: the interval shows both whether there's an effect and how big it could be. "Significant, but the lift could be as small as 0.17 points" is a very different business case from "significant, and at least 1 point".
What are type I and type II errors?
A type I error is a false alarm: the test says B wins, but B is really no better. A type II error is a missed win: B really is better, but the test says there's no difference.
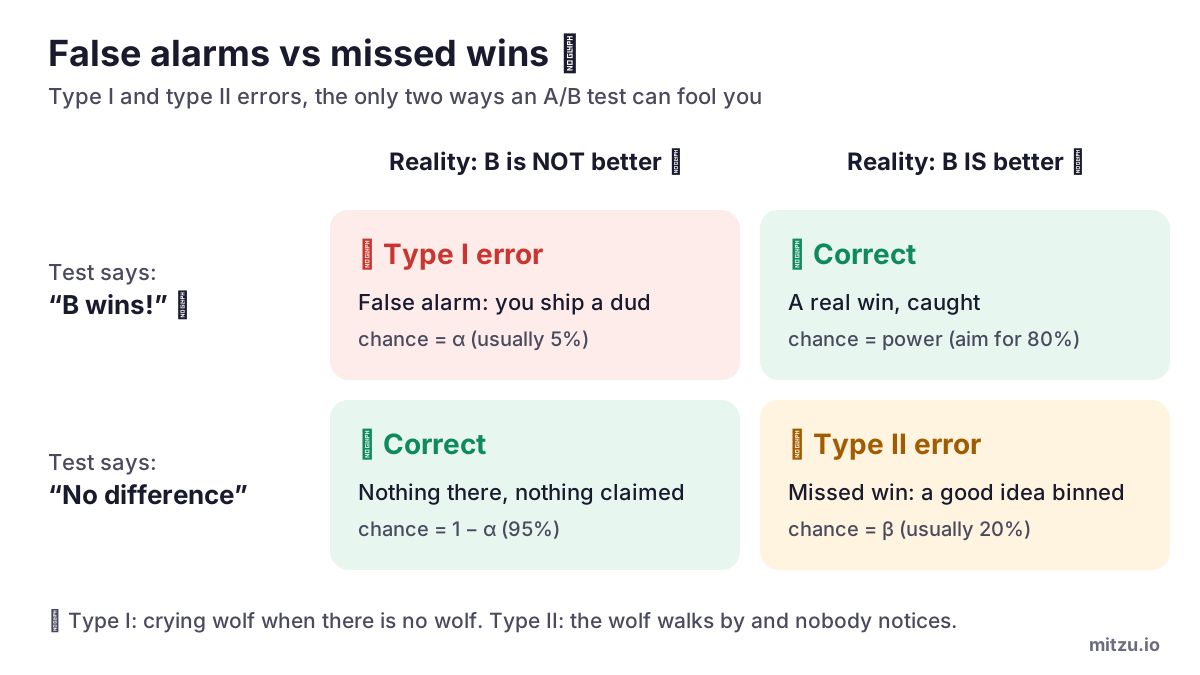
🐺 The boy who cried wolf covers both. Crying "wolf!" when there's no wolf is a type I error. The wolf strolling past while everyone says "nothing to see" is a type II error. You control the type I rate with α (0.05 means 5% false alarms when nothing is going on) and the type II rate with sample size, through statistical power.
What is statistical power?
Statistical power is the probability that your test detects a real effect of a given size. The usual target is 80%: if B truly lifts conversion by the amount you care about, you want a 4-in-5 chance that the test says so. Power is 1 − β, where β is the type II error rate.
💪 The pizza test had 10,000 visitors per version. If B's true lift really is 0.8 points (5.0% → 5.8%), a test that size catches it only about 71% of the time. In roughly 3 out of 10 parallel universes, the same good button gets binned as "no difference" 😴. Underpowered tests are one of the most common reasons good ideas get thrown away.
How many users do you need for an A/B test?
It depends on your baseline conversion rate and the smallest lift you care about detecting, called the minimum detectable effect (MDE). At a 5% baseline, with 95% significance and 80% power, detecting a 1-point lift (5% → 6%) takes about 8,200 users per variant. Detecting a 0.5-point lift takes about 31,200.
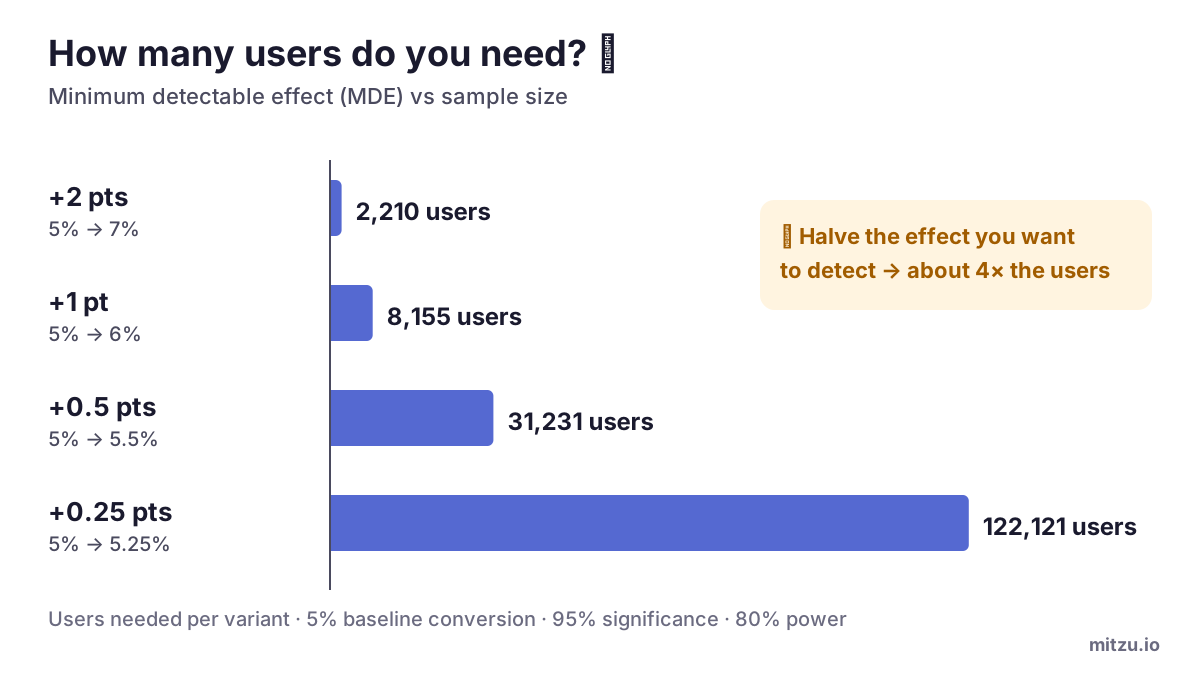
The pattern holds because noise shrinks with the square root of the sample size: to halve the noise, you need four times the users. Low baseline rates make it worse, as the table shows for a 10% relative lift:
| Baseline conversion | Target (10% relative lift) | Users needed per variant |
|---|---|---|
| 2% | 2.2% | 80,679 |
| 5% | 5.5% | 31,231 |
| 10% | 11% | 14,749 |
| 20% | 22% | 6,507 |
📐 Back-of-the-envelope version (Lehr's rule): users per variant ≈ 16 × p × (1 − p) ÷ MDE², where p is your baseline rate and MDE is in the same units. For a 5% baseline and a 1-point MDE: 16 × 0.05 × 0.95 ÷ 0.01² ≈ 7,600. A proper calculator gives about 8,200, which is close enough to tell whether your test is realistic before you build it.
⚠️ Decide the sample size before the test starts, then run until you reach it, ideally in whole weeks so that both weekdays and weekends are counted.
Why is peeking at A/B test results a problem?
Checking results every day and stopping the moment p dips below 0.05 pushes your false-alarm rate far above 5%. The p-value naturally wanders up and down while data comes in, so if you check often enough, luck alone will eventually cross the line.
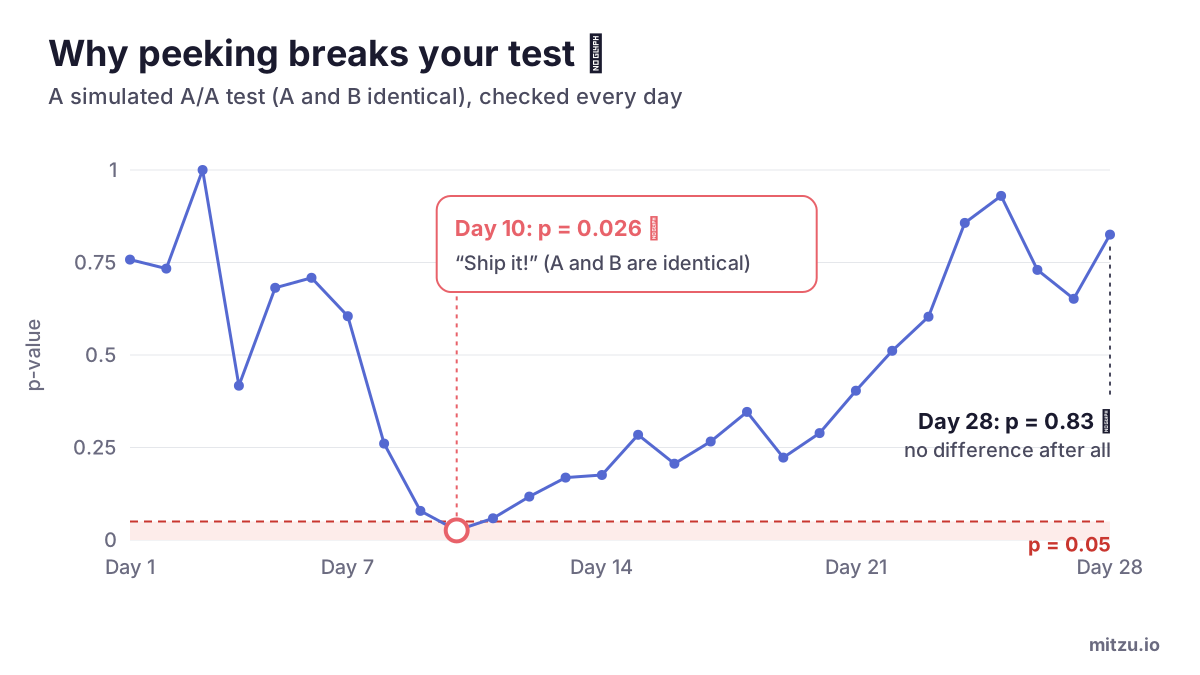
👀 In this simulated A/A test, a daily peek on day 10 shows p = 0.026, a "winner" 🥳. By day 28, p = 0.83. There was never anything to find. The fix: pick the sample size up front and judge the result once, at the end, or use a method built for continuous monitoring (sequential testing), which many experimentation tools offer.
The 7 most common A/B testing mistakes 🙈
- 👀 Peeking and stopping early. See above: it turns 1-in-20 false alarms into far more.
- 🎣 Testing 20 metrics and celebrating the one that's significant. At α = 0.05, about 1 metric in 20 "wins" by luck alone. Pick one primary metric in advance.
- 🐜 Running underpowered tests. With too few users, "no difference" really means "we can't tell".
- ⚖️ Ignoring a sample ratio mismatch. If you planned a 50/50 split and got 10,000 vs 9,400 users, the assignment is broken (a gap that size is very unlikely by chance). Fix it before trusting any p-value.
- 🗓️ Stopping mid-week. People behave differently on Monday and Saturday. Run whole weeks.
- ✨ Falling for the novelty effect. Users click new things because they're new. Check whether the lift holds after the first few days.
- 📏 Confusing significant with important. Check the confidence interval and the business value, not just p < 0.05.
A/B test checklist: 7 steps from idea to decision 🧭
- 📝 Write a hypothesis. "Changing the button text to 'Get my pizza' will increase orders, because it's more concrete."
- 🎯 Pick one primary metric (order conversion rate) and a few guardrail metrics that must not get worse (refunds, page load time).
- 📐 Choose α (0.05), power (80%) and your MDE, then calculate the sample size.
- 🪙 Randomize users, not page views, into A and B, and log who saw which version.
- ⏳ Run until you reach the sample size, in whole weeks. No peeking and stopping.
- 🧮 Analyze: a z-test for rates, Welch's t-test for averages. Report the lift with its confidence interval.
- ✅ Decide and write it down: ship, drop, or iterate. Record the result so nobody re-runs the same test next year.
A/B test results live in your data warehouse
Most experimentation setups do two jobs: they assign users to A or B, and they record that assignment as an exposure event. The outcomes you actually care about (orders, subscriptions, week-2 retention, revenue) usually end up in your data warehouse, such as Snowflake, BigQuery, Databricks, Redshift or ClickHouse, next to everything else you know about those users. That's where analysis gets interesting, because joining experiment exposures with billing, CRM or support data answers questions a testing tool's own dashboard can't. We covered the data-modeling side in Modeling A/B Tests in the Data Warehouse.
Mitzu is an agentic product analytics platform that runs on your data warehouse and answers behavioural questions through natural-language conversation, without writing SQL. It isn't an A/B testing platform and doesn't assign users to variants. It analyzes the experiment data you already store: each variant becomes a subsegment in funnel, retention and segmentation insights, so you can compare A and B on any event in the warehouse, not only the one metric the test was set up for.
You can also ask the Analytics Agent directly, for example: "Did users in variant B of the onboarding experiment retain better at day 7 than variant A?" The Analytics Agent answers questions about user behaviour by assembling analysis specifications that a deterministic query engine turns into SQL, with no hallucinated queries. Per-variant user counts and conversion rates are exactly what the z-test above needs. For a t-test, you also need each variant's per-user average and standard deviation, calculated over every assigned user. See impact analysis with Mitzu for more, or try it on your own warehouse.
FAQ
Does a p-value of 0.05 mean there is a 5% chance my result is a fluke?
No. It means that if A and B were truly identical, you would see a gap at least this large about 5% of the time. That is a statement about the data under the assumption of no effect, not the probability that the effect is real. To talk about "the chance that B is better", you need a Bayesian analysis.
What does 95% statistical significance mean in an A/B test?
It means the test uses a significance level (α) of 0.05: you only call a winner when the p-value is below 0.05. That caps the false-alarm rate at 5% when there is no real difference between A and B.
How long should an A/B test run?
Until it reaches the sample size you calculated before starting, and for at least one full week (ideally two) so every day of the week is represented. Divide the users needed per variant by the daily users each variant receives to get the number of days.
Can I stop an A/B test as soon as it is significant?
Not with a standard fixed-sample test. Stopping at the first p-value below 0.05 inflates false positives well above 5%. Either wait for the planned sample size or use a sequential testing method designed for early stopping.
What is the difference between A/B testing and split testing?
There is none: they are two names for the same thing. Some people use "split testing" specifically for comparing two separate URLs (split URL testing), but the statistics are identical.
What is an A/A test?
An A/A test shows the same version to both groups. It should come out not significant about 95% of the time. Teams run one to check that user assignment and tracking work, and to see how much results wobble by chance.
Is an A/B test the same as a randomized controlled trial?
Yes. An A/B test is a randomized controlled trial run on a digital product: users are randomly assigned to a control (A) or a treatment (B), and the outcomes are compared with the same statistics used in medical and scientific trials.
Should I use a one-tailed or a two-tailed test?
Use a two-tailed test unless you have a strong reason not to. A two-tailed test catches B being better or worse; a one-tailed test only looks in one direction, which makes a winner easier to call but leaves you blind to harm.
Is frequentist or Bayesian A/B testing better for beginners?
Both work. Frequentist tests (p-values, z-tests and t-tests, everything in this guide) are the most common and what most reports show. Bayesian tests report the probability that B beats A, which many people find more intuitive. Discipline matters more than the method: pick your metric and sample size up front and do not stop early.
Can I analyze A/B test results in my data warehouse?
Yes. If exposure events (who saw A or B) and outcome events land in your warehouse, you can calculate per-variant conversion rates and averages with SQL or with a warehouse-native analytics tool such as Mitzu, then apply the z-test or t-test from this guide.