TL;DR
Understand what conversion funnel analysis is and learn how to calculate it to track user behavior, identify drop-offs, and improve your sales or product funnel. Funnel analysis measures how many users complete each step of an ordered sequence, such as visit, sign up, activate and purchase, and where the rest drop off.
Funnel analysis measures how many users complete each step of an ordered sequence, such as visit, sign up, activate and purchase, and where the rest drop off. Each step's conversion rate is the share of users who reached the previous step and also completed this one within a set conversion window, so the funnel shows exactly which step loses the most users.
Funnel conversion rate: divide the users who completed the last step by the users who entered the first step and multiply by 100. If 10,000 users visit, 2,000 sign up and 500 activate within seven days, the funnel converts at 5%, the signup step at 20% and the activation step at 25%. The step with the lowest conversion is usually the first place to look.
What is Conversion Funnel Analysis?
Funnel analysis is a key method for understanding how users move through the stages of your product or sales process. It helps you visualize the journey users take from the first interaction with your product to completing a desired action, such as making a purchase or signing up. Funnel analysis definition focuses on tracking and analyzing this progression, which is known as the funnel conversion analysis.
The conversion funnel analysis is crucial because it helps you identify where users drop off, in other words churn in their journey. By analyzing the different stages of the funnel, you can pinpoint the drop-off points where users are most likely to abandon the process. By identifying and addressing these friction points, businesses can optimize their overall user journey, turning more leads into customers and increasing conversion rates.
Why does funnel analysis matter?
Understand user drop-Off
Funnel analysis are essential for identifying where users drop off in the conversion process. By analyzing funnel data, you can pinpoint the exact stages where users abandon their journey, helping you understand the critical points in your product. This information is invaluable for refining your product and focusing on improvement areas. By addressing these drop-off points, you can optimize the experience and reduce friction, ultimately increasing user retention and boosting conversions.
Find the best converting segments
Not all users behave the same; some segments convert better than others. User segmentation with funnel analysis, you can uncover which groups of users are more likely to complete the desired action. Whether based on demographic information or user behavior, segmentation helps you understand what drives conversions for different types of users. This allows you to tailor your marketing and product features to meet the specific needs of high-converting segments, improving overall conversion rates.
Measure time to convert
While conversion rate is an important metric, knowing how long it takes users to convert is equally essential. Understanding conversion funnel analysis - how quickly users move through the funnel helps you identify slow points in the process. By measuring conversion funnel analysis, you can optimize for faster conversions. Reducing bottlenecks and simplifying the process can speed up conversion times, ultimately enhancing user experience and boosting efficiency.
Where can I use Funnel Analysis?
Marketing
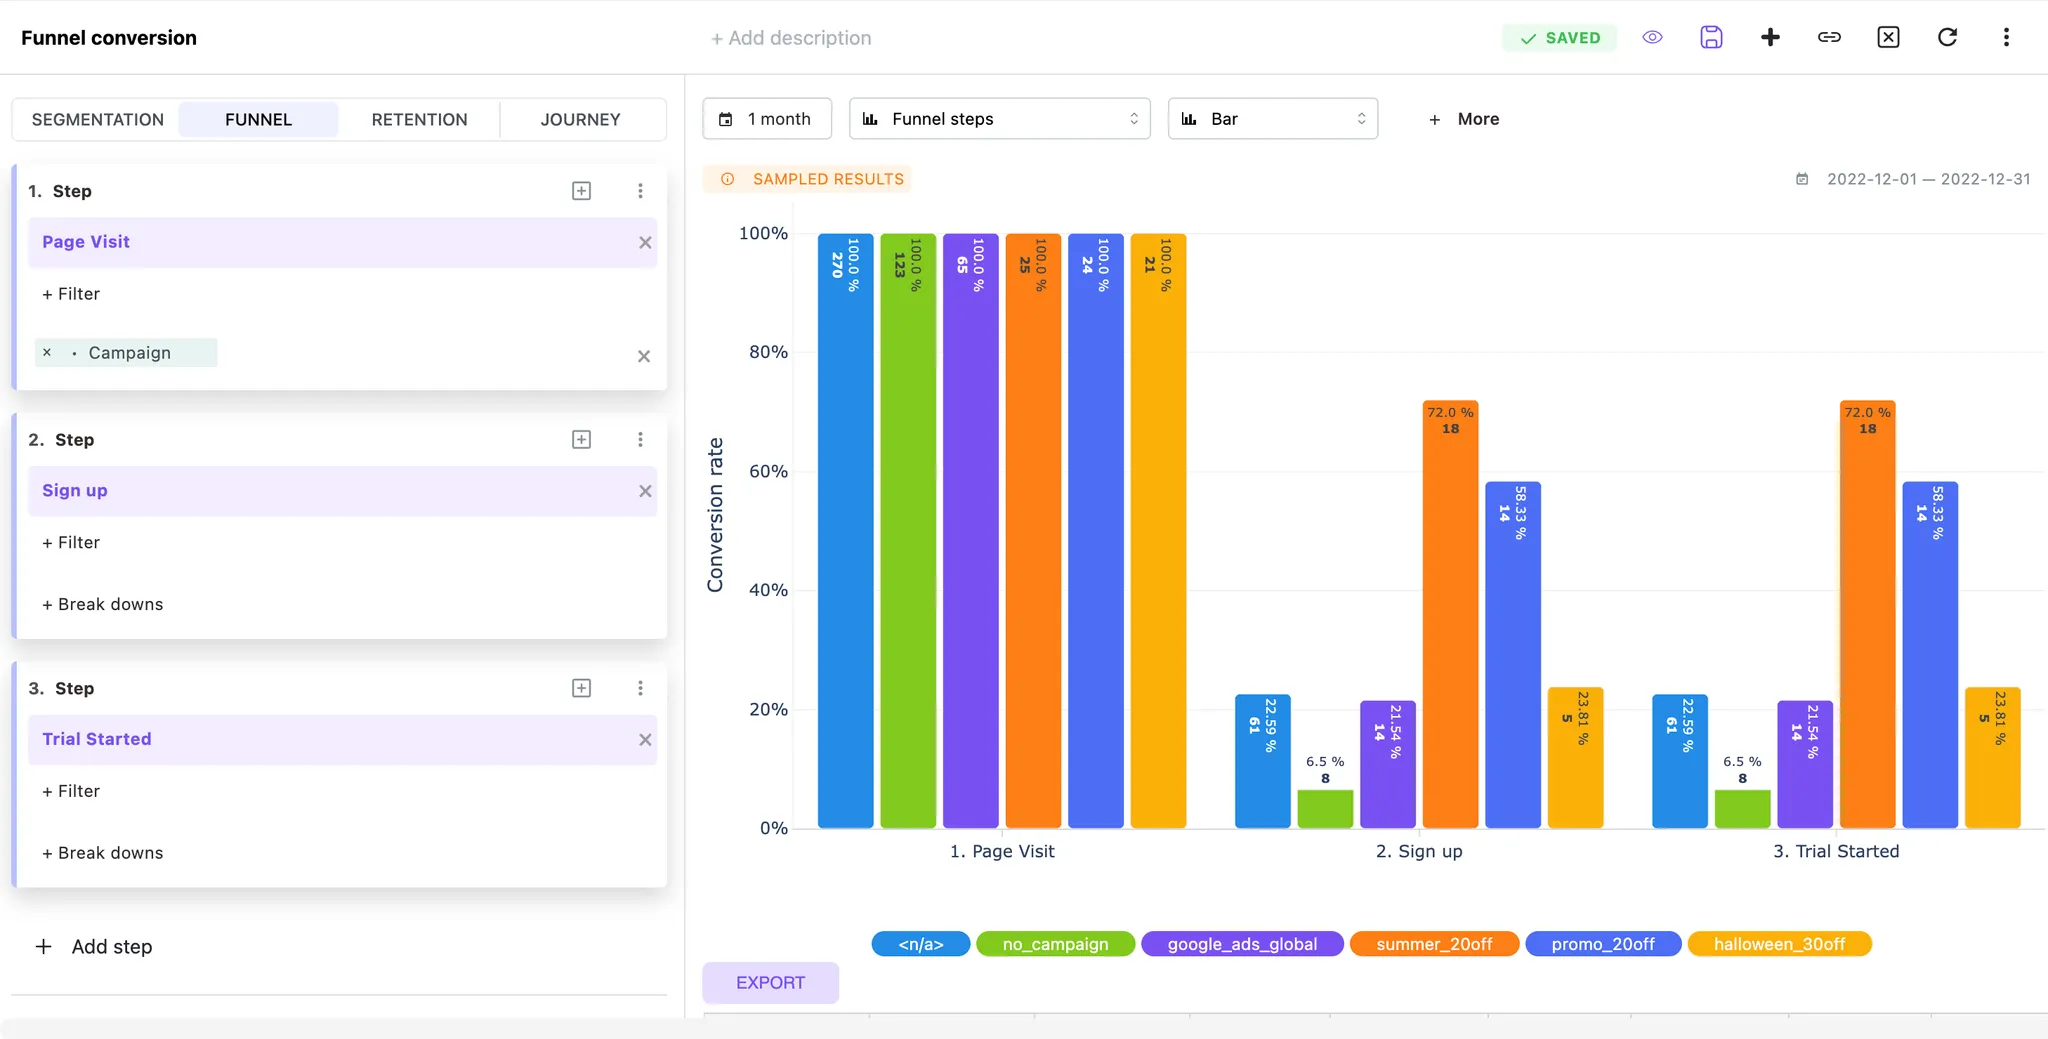
By understanding user behavior at each funnel stage, marketing funnel analysis can optimize campaigns while they run, focusing resources where they have the greatest impact on growth and retention. Metrics like signup rate per acquisition campaign highlight top-performing campaigns, while the visitor-to-meeting booked ratio improves sales. Additionally, analyzing user distribution across regions, devices, and other properties helps pinpoint successful areas and opportunities for improvement.
Product
It offers product teams a clear view of how users engage with digital products, from their first interaction to becoming regular users. This insight helps teams decide which features to improve or remove. By examining user interactions with features, aka feature adoption rate, tracking the journey from first-time use to regular engagement, and pinpointing drop-off points, teams can refine the user experience and increase engagement and retention.
Sales and Customer Success

By analyzing each stage of the customer journey - from initial interest to final purchase - teams can optimize their strategies to remove bottlenecks, speed up the sales cycle, and close more deals with improved customer satisfaction. Metrics like MRR and understanding the user journey during trial help refine the process and ensure a smoother transition from prospect to loyal customer.
Which is the best conversion funnel analysis tool?
If your event and business data already sit in a data warehouse, Mitzu is built for this. Mitzu is an analytics platform on your data warehouse for BI, product analytics and experiment analysis, where the data team governs the metrics and everyone uses them through dashboards, an AI agent, Slack and their own AI assistants. Funnels run on the warehouse tables in place, with step order and the conversion window handled by a deterministic query engine, so the funnel the agent builds matches the one on the dashboard, and a drop in a KPI can be followed to the funnel step behind it. For the wider market, see the best funnel analysis tools.
Funnel steps are rarely the goal in themselves. Signup rate and activation rate are usually inputs in a metric tree that rolls up to revenue or your north star, which tells you which step is worth fixing first.
You can analyze how users interact with specific features, so you'll know which ones are most popular and which might need a little tweaking. If users leave at certain stages, you can quickly figure out where things are going wrong and adjust to get them back on track. Plus, by measuring how long it takes for users to convert, you can speed up the process and help them reach their goals faster. You'll also be able to segment your users to focus on the groups most likely to convert.
Start free on your warehouse, or book a demo to see your own funnels next to the KPIs they drive.
FAQ
Who is this guide for?
It is written for product, growth and data teams who need to measure conversion between steps, find where users drop off, and decide which part of the journey to fix first.
What decisions does it help you make?
It highlights trade-offs around schema design, governance, self-serve access, and how analysis stays tied to the warehouse instead of a separate product silo.
Where should I go next for execution?
To see how a funnel is computed on warehouse tables, read funnels with SQL. To track whether converted users keep coming back, pair funnels with cohort retention.
How do you do a funnel analysis step by step?
Define the goal event, list the steps users take before it in order, and pick a conversion window, such as seven days from the first step. Count the unique users who reach each step within the window, divide each step by the one before it to get step conversion, and break the result down by channel, device or plan to see where the drop-off concentrates. Then change the weakest step and measure again, ideally with an A/B test.
What is the difference between funnel analysis and cohort analysis?
Funnel analysis follows users through an ordered sequence of steps within one window and shows where they drop off on the way to a goal. Cohort analysis groups users by when they started, usually their signup week, and tracks how each group behaves over time, such as the share that comes back each week. Funnels show where users get stuck; cohort retention shows whether they stay.