TL;DR
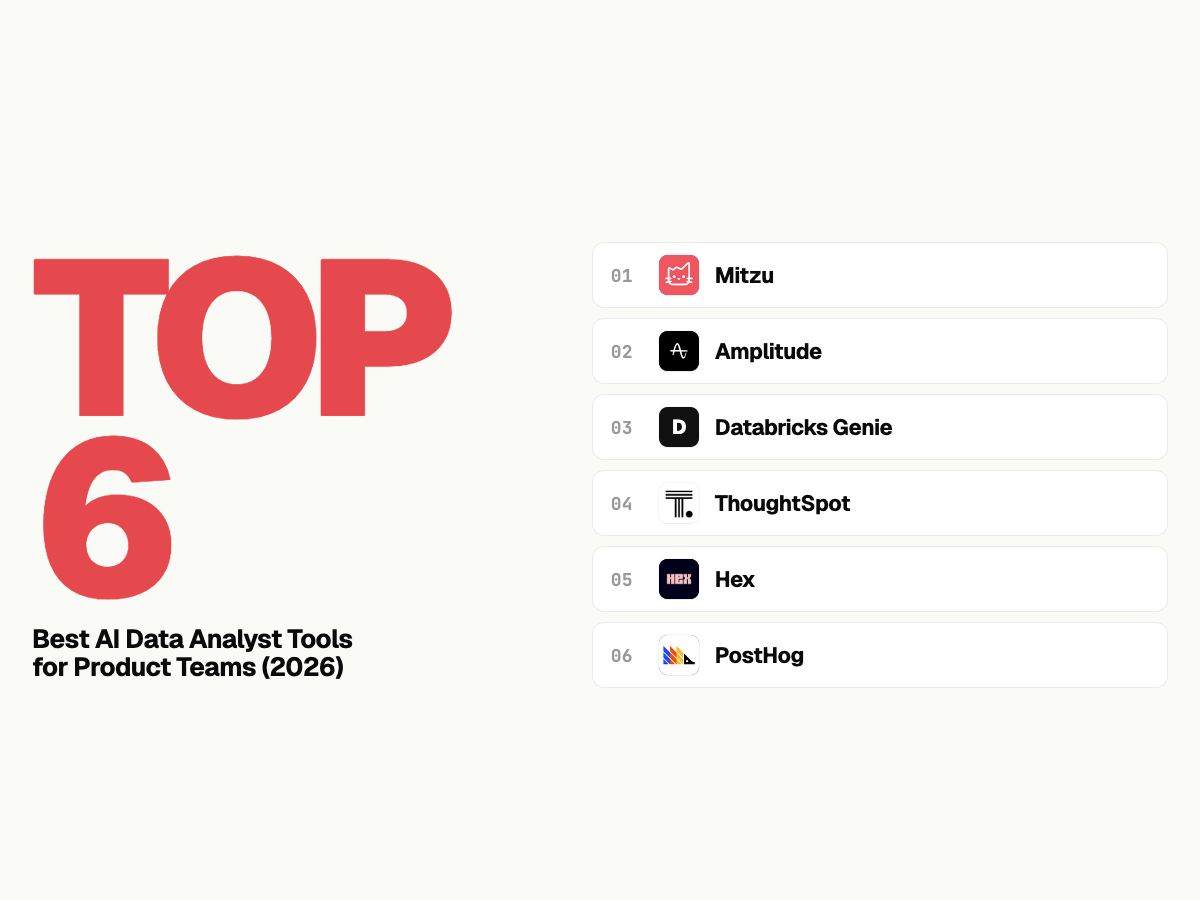
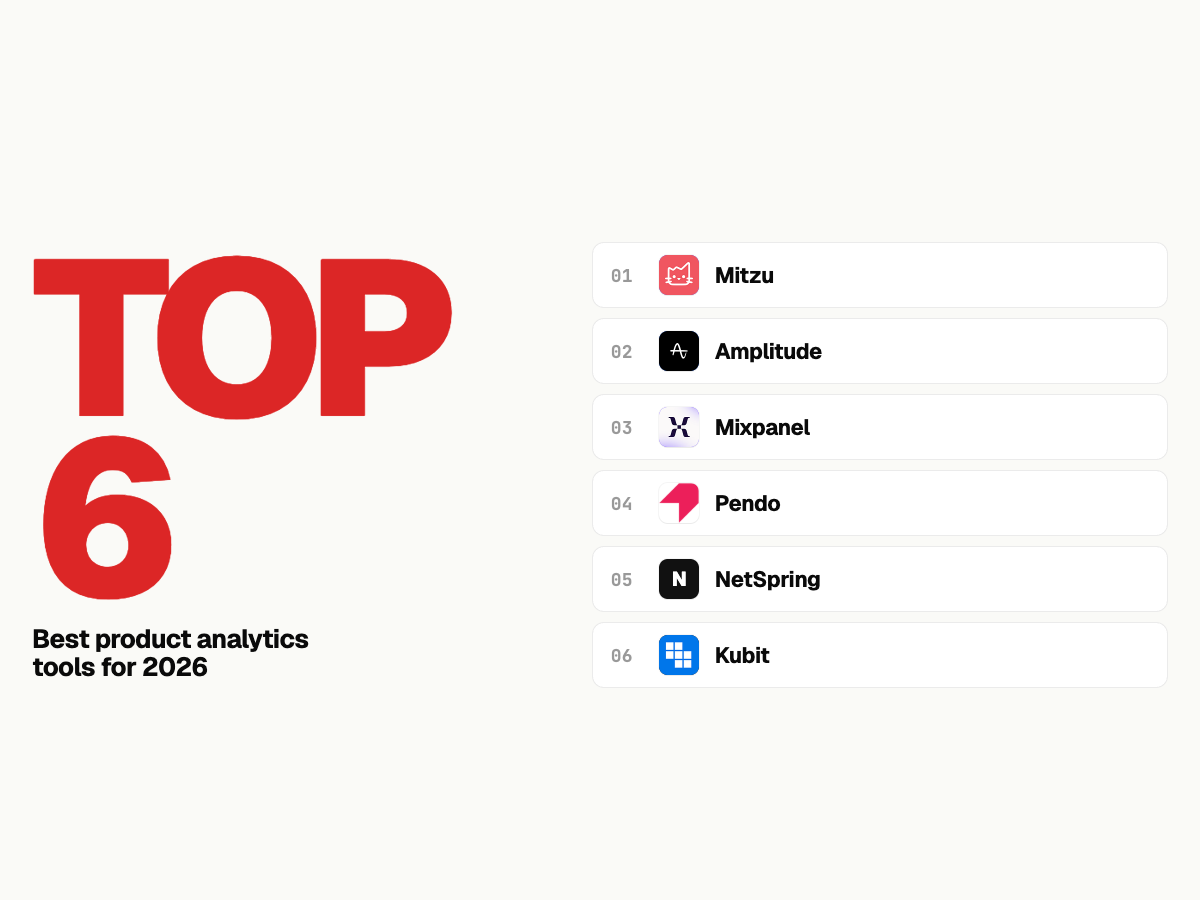
Compare top 5 product analytics tools by features, pricing model, and data architecture. Use this 2026 buyer guide to shortlist the right platform before committing.
Use this comparison to evaluate tools through an agentic analytics lens: which platform enables an AI data analyst workflow with trusted SQL and a trusted semantic layer, not just faster dashboarding.
What is Product Analytics, and why is it important?
Product analytics involves collecting, measuring, and analyzing user interactions with your product. Instead of focusing on what the product was designed to do, it emphasizes how users engage with it. It tracks specific events and their properties and groups them to reveal meaningful patterns.
Mitzu vs Amplitude vs Mixpanel vs Pendo vs Netspring (Optimizely) for Product Analytics
*Assuming 1M active users or visitors, one user generates 50 monthly events and 10 product managers.
| Feature / Company | Amplitude | Mixpanel | Pendo | Mitzu | Netspring | Kubit |
|---|---|---|---|---|---|---|
| Price (yearly) - monthly 1M visitor | $150K | $150K | $150K | $12K | $12K | $150K |
| Segmentation | ★★★★ | ★★★★ | ★★★★ | ★★★★★ | ★★★★ | ★★★★ |
| Funnels | ★★★★★ | ★★★★★ | ★★★★★ | ★★★★ | ★★★★ | ★★★ |
| Retention | ★★★★ | ★★★ | ★★★ | ★★★★ | ★★★ | ★★★ |
| Journey | ★★★★★ | ★★★★ | ★★★ | ★★★★★ | ★★★ | ★★★ |
| A/B Test Analytics | ★★★★ | ★★★★ | ★★★★ | ★★★ | ★★★★ | ★★★ |
| Sales Analytics | ★★★ | ★★★ | ★★ | ★★★★ | ★★ | ★★ |
| Event volume limits | Up to 10M free | Up to 10M free | Up to 20M free | Unlimited tracked events, users | Not available | Up to 10M free |
| Real-Time Interaction Tracking | ☑️ | ☑️ | ☑️ | ❌ | ❌ | ❌ |
1. Mitzu
The main features of Mitzu
- Warehouse-Native Product Analytics with Automatic SQL Query Generation: Mitzu is the leading trusted agentic product analytics tool. It simplifies data analysis by automatically generating SQL queries based on your inputs, and it works directly on your data warehouse.
- User Journey and Retention Analysis: You can track user interactions across various touchpoints to understand their journey and improve retention strategies.
- Campaign Conversion Tracking: You can measure the effectiveness of your marketing campaigns by tracking conversion rates and user engagement.
- Individual User Lookup and Cohort Analysis: You can analyze user behavior by creating cohorts based on shared characteristics or actions, enabling targeted insights into product performance.
- Segmentation: It easily segments users based on specific characteristics or behaviors, allowing for targeted analysis and personalized strategies.Mitzu allows you to create targeted user segments based on specific parameters such as pricing plans, company, and location, providing a more tailored approach to user analysis.
- Funnel Analysis: It examines user behavior sequentially to identify churn points and optimize conversion rates.
- Subscription analytics (MRR, Subscribers): It is the only tool among the other 5 that can handle subscription analytics.
- Mitzu allows you to create targeted user segments based on specific parameters such as pricing plans, company, and location, providing a more tailored approach to user analysis.
Pricing
Mitzu offers transparent seat-based pricing. You can track as many events and users as you need without additional costs. However, as a semantic-layer grounded product analytics solution, your data warehouse costs may increase.
2. Amplitude
The main features of Amplitude
- Behavioral Analytics can provide comprehensive insights into customers' behavior and preferences, allowing you to analyze the impact of your marketing efforts effectively.
- User Segmentation and Event Tracking: You can divide your customers into groups based on specific characteristics and track individual user events. This helps you tailor your strategies for different segments.
- Real-time Analytics and A/B Testing: You can access up-to-the-minute insights, enabling you to experiment with various approaches and optimize user experiences in real time.
- Product Paths and Conversion Funnels allow you to track user journeys and identify abandonment points, fine-tune customer experiences, and improve conversion rates.
Pricing
Amplitude's pricing is event-based, meaning costs increase with the number of events tracked. For a site with 1M active users or visitors, assuming each user generates 50 monthly events, Amplitude would cost approximately $150K (rough estimation)
3. Mixpanel
The main features of Mixpanel
- Event Tracking and Segmentation: You can monitor user actions and segment users based on their behaviors, attributes, and cohorts. This lets you gain detailed insights into how different groups interact with your product.
- Funnel and Retention Analysis: You can evaluate user journeys and conversion rates while analyzing user retention over time. This helps you understand where users drop off and how to keep them engaged.
- A/B Testing allows you to experiment to optimize user experiences and product features. This allows you to test different approaches and see what resonates best with your audience.
- Custom Dashboards and Real-Time Reporting: You can create customized visualizations to suit your specific needs and access live data on current user activity and trends. This will keep you informed and agile in your decision-making.
- Integration Flexibility: You can easily integrate with various tools and platforms for comprehensive data analysis. This flexibility allows you to leverage your existing tech stack while enhancing your analytics capabilities.
Pricing
Mixpanel's pricing is based on Monthly Tracked Users (MTU), meaning costs increase with the number of users you track. For a site with 1M active users or visitors, assuming each user generates 50 monthly events, Mixpanel would cost approximately $150K (rough estimation).
4. Pendo
The main features of Pendo
- In-App Guidance: You can create in-app messages, tooltips, and walkthroughs that guide users through your product. This support improves feature adoption and helps users get the most out of your offerings.
- User Feedback Collection: In-app surveys and feedback mechanisms can gather valuable user insights, helping you better understand user needs and preferences.
- Feature Planning and Roadmapping: Data-driven insights can help prioritize feature development and product improvements, ensuring you focus on what truly matters to your users.
- Customer Journey Mapping allows you to visualize and optimize the customer journey across different touchpoints. This helps you identify opportunities to enhance user engagement and satisfaction.
Pricing
Pendo's pricing is not publicly available but is likely similar to Amplitude's. Pendo uses a Monthly Tracked User (MTU) model, meaning costs increase with the number of users tracked. For a site with 1 million active users or visitors, assuming each user generates 50 monthly events, the cost would be approximately $150K (rough estimation).
5. Netspring (acquired by Optimizely)
The main features
- Self-Service: You can access a rich library of product analytics reports and easily switch between reports and ad hoc visual data exploration. This flexibility allows you to find answers to your questions quickly and efficiently.
- Warehouse-Native: In your data warehouse, you can integrate product instrumentation with any business data, enabling comprehensive, context-rich analysis. This means you can leverage all your data for deeper insights without the hassle of data duplication.
- SQL Option: You can simplify funnel and path queries without writing complex SQL. However, if you prefer, you still have the option to use SQL for specialized analyses, giving you the best of both worlds.
- Product and Customer Analytics: You can utilize solutions for behavioral analytics, marketing analytics, operational analytics, customer 360 views, product 360 insights, and SaaS product-led growth (PLG) strategies.
- Optimizely acquired Netspring: The future of this product is uncertain. It may potentially cease to exist as an independent offering.
6. Kubit
Main features
- User Engagement: It helps you discover which user behaviors contribute to higher lifetime value and learn effective strategies for retaining and expanding your user base.
- Feature Engagement: You can identify which product features drive the most engagement and help create power users within your product.
- Conversion Analysis: Understand how users navigate key funnels in your product and pinpoint areas that may lead to drop-offs. This will allow you to address these issues effectively.
- Consumption Patterns: Gain insights into which product features and content to promote and which ones to phase out.
Pricing
Kubit pricing is based on Monthly Tracked Users (MTU), meaning costs increase with the number of users tracked. For a site with 1M active users or visitors, assuming each user generates 50 monthly events, Kubit would cost approximately $50K–$150K (rough estimation). Exact pricing is not publicly available.
What Are the Key Takeaways?
What is the best product analytics tool for SaaS?
Use a third-party analytics tool for small user bases without a data warehouse. For large user bases or if you already maintain a cloud warehouse, use semantic-layer grounded solutions are more efficient and cost-effective.
Which product analytics tool works with my data warehouse?
Mitzu stands out here as it's "warehouse‑native," meaning it runs analysis directly on your existing data warehouse and avoids extra ETL or data duplication. It results 100% data accuracy and privacy.
Looking for an AI analytics agent?
If you are evaluating tools because reporting is slow, Mitzu gives product, marketing, and data teams an AI analytics agent that answers questions with verified SQL on your warehouse. Explore AI agents, see Snowflake and BigQuery workflows, and start free with your own data.
When to choose agentic analytics over traditional tools?
- Choose agentic analytics when your teams depend on ad-hoc SQL requests and dashboard backlog cycles.
- Choose it when you need natural-language questions with transparent, analyst-reviewable SQL.
- Choose it when product and marketing decisions must run on first-party warehouse data without copying events to third-party silos.
FAQ
How were the tools in this guide evaluated?
We focus on data architecture (semantic-layer grounded versus copied event stores), pricing model, depth of product and marketing analytics (funnels, retention, journeys), and how well non-technical teams can self-serve without writing SQL.
Which approach best keeps a single source of truth in the data warehouse?
Semantic-layer grounded and zero-copy approaches run analysis on your cloud warehouse so permissions and governance stay in one place. See trusted agentic analytics for how this differs from tools that sync events into a separate vendor database.
How does this relate to agentic analytics and AI data analysts?
Modern teams pair agentic analytics with governed warehouse data. An AI analytics agent or AI data analyst workflow is most reliable when product metrics live in the warehouse and SQL stays transparent.