
TL;DR
Sample ratio mismatch (SRM) means the observed split of users between variants is too far from the planned split to be chance, so some users were lost, added or misassigned in a way that can bias every metric. Detect it with a chi-square goodness-of-fit test on user counts per variant. The usual threshold is p < 0.001, which for two variants means a chi-square statistic above 10.83. On a warehouse, count distinct users per variant from the exposure table, compare them with the planned shares in SQL, and count users who appear in more than one variant.
Sample ratio mismatch (SRM) is when the number of users in each variant of an A/B test differs from the split you configured by more than chance can explain, which means something in assignment, exposure logging or analysis is broken and the test's results cannot be trusted.
It is the most common data quality check in experimentation, and one of the cheapest to run. This guide covers why SRM invalidates a result, what usually causes it, how to detect it with a chi-square test (with the numbers worked through), and how to run the check in SQL on the exposure data your experimentation tool writes to Snowflake, BigQuery, Databricks, Redshift or another warehouse.
What is sample ratio mismatch?
Every A/B test has a planned allocation: 50/50, 90/10, or three equal variants. Random assignment never produces that allocation exactly. Run a fair 50/50 test on 2,000 users and you might see 1,010 in control and 990 in treatment, which is normal noise. SRM is the case where the gap is larger than that noise allows for the number of users you have.
The same ratio can be fine at one sample size and a clear SRM at another. 1,010 vs 990 is a 50.5/49.5 split and nothing to worry about. 101,000 vs 99,000 is the same 50.5/49.5 split, and the chance of seeing it from a fair 50/50 assignment is about 1 in 130,000. You cannot judge SRM by eye, which is why it needs a test.
Why SRM invalidates A/B test results?
Randomization is what lets you read a difference between variants as the effect of the change. Control and treatment are supposed to be two random samples from the same population, so the only systematic difference between them is the variant they saw. SRM says that is no longer true. Some users went missing from one group, or extra users were added to it, and the users who went missing are rarely a random subset.
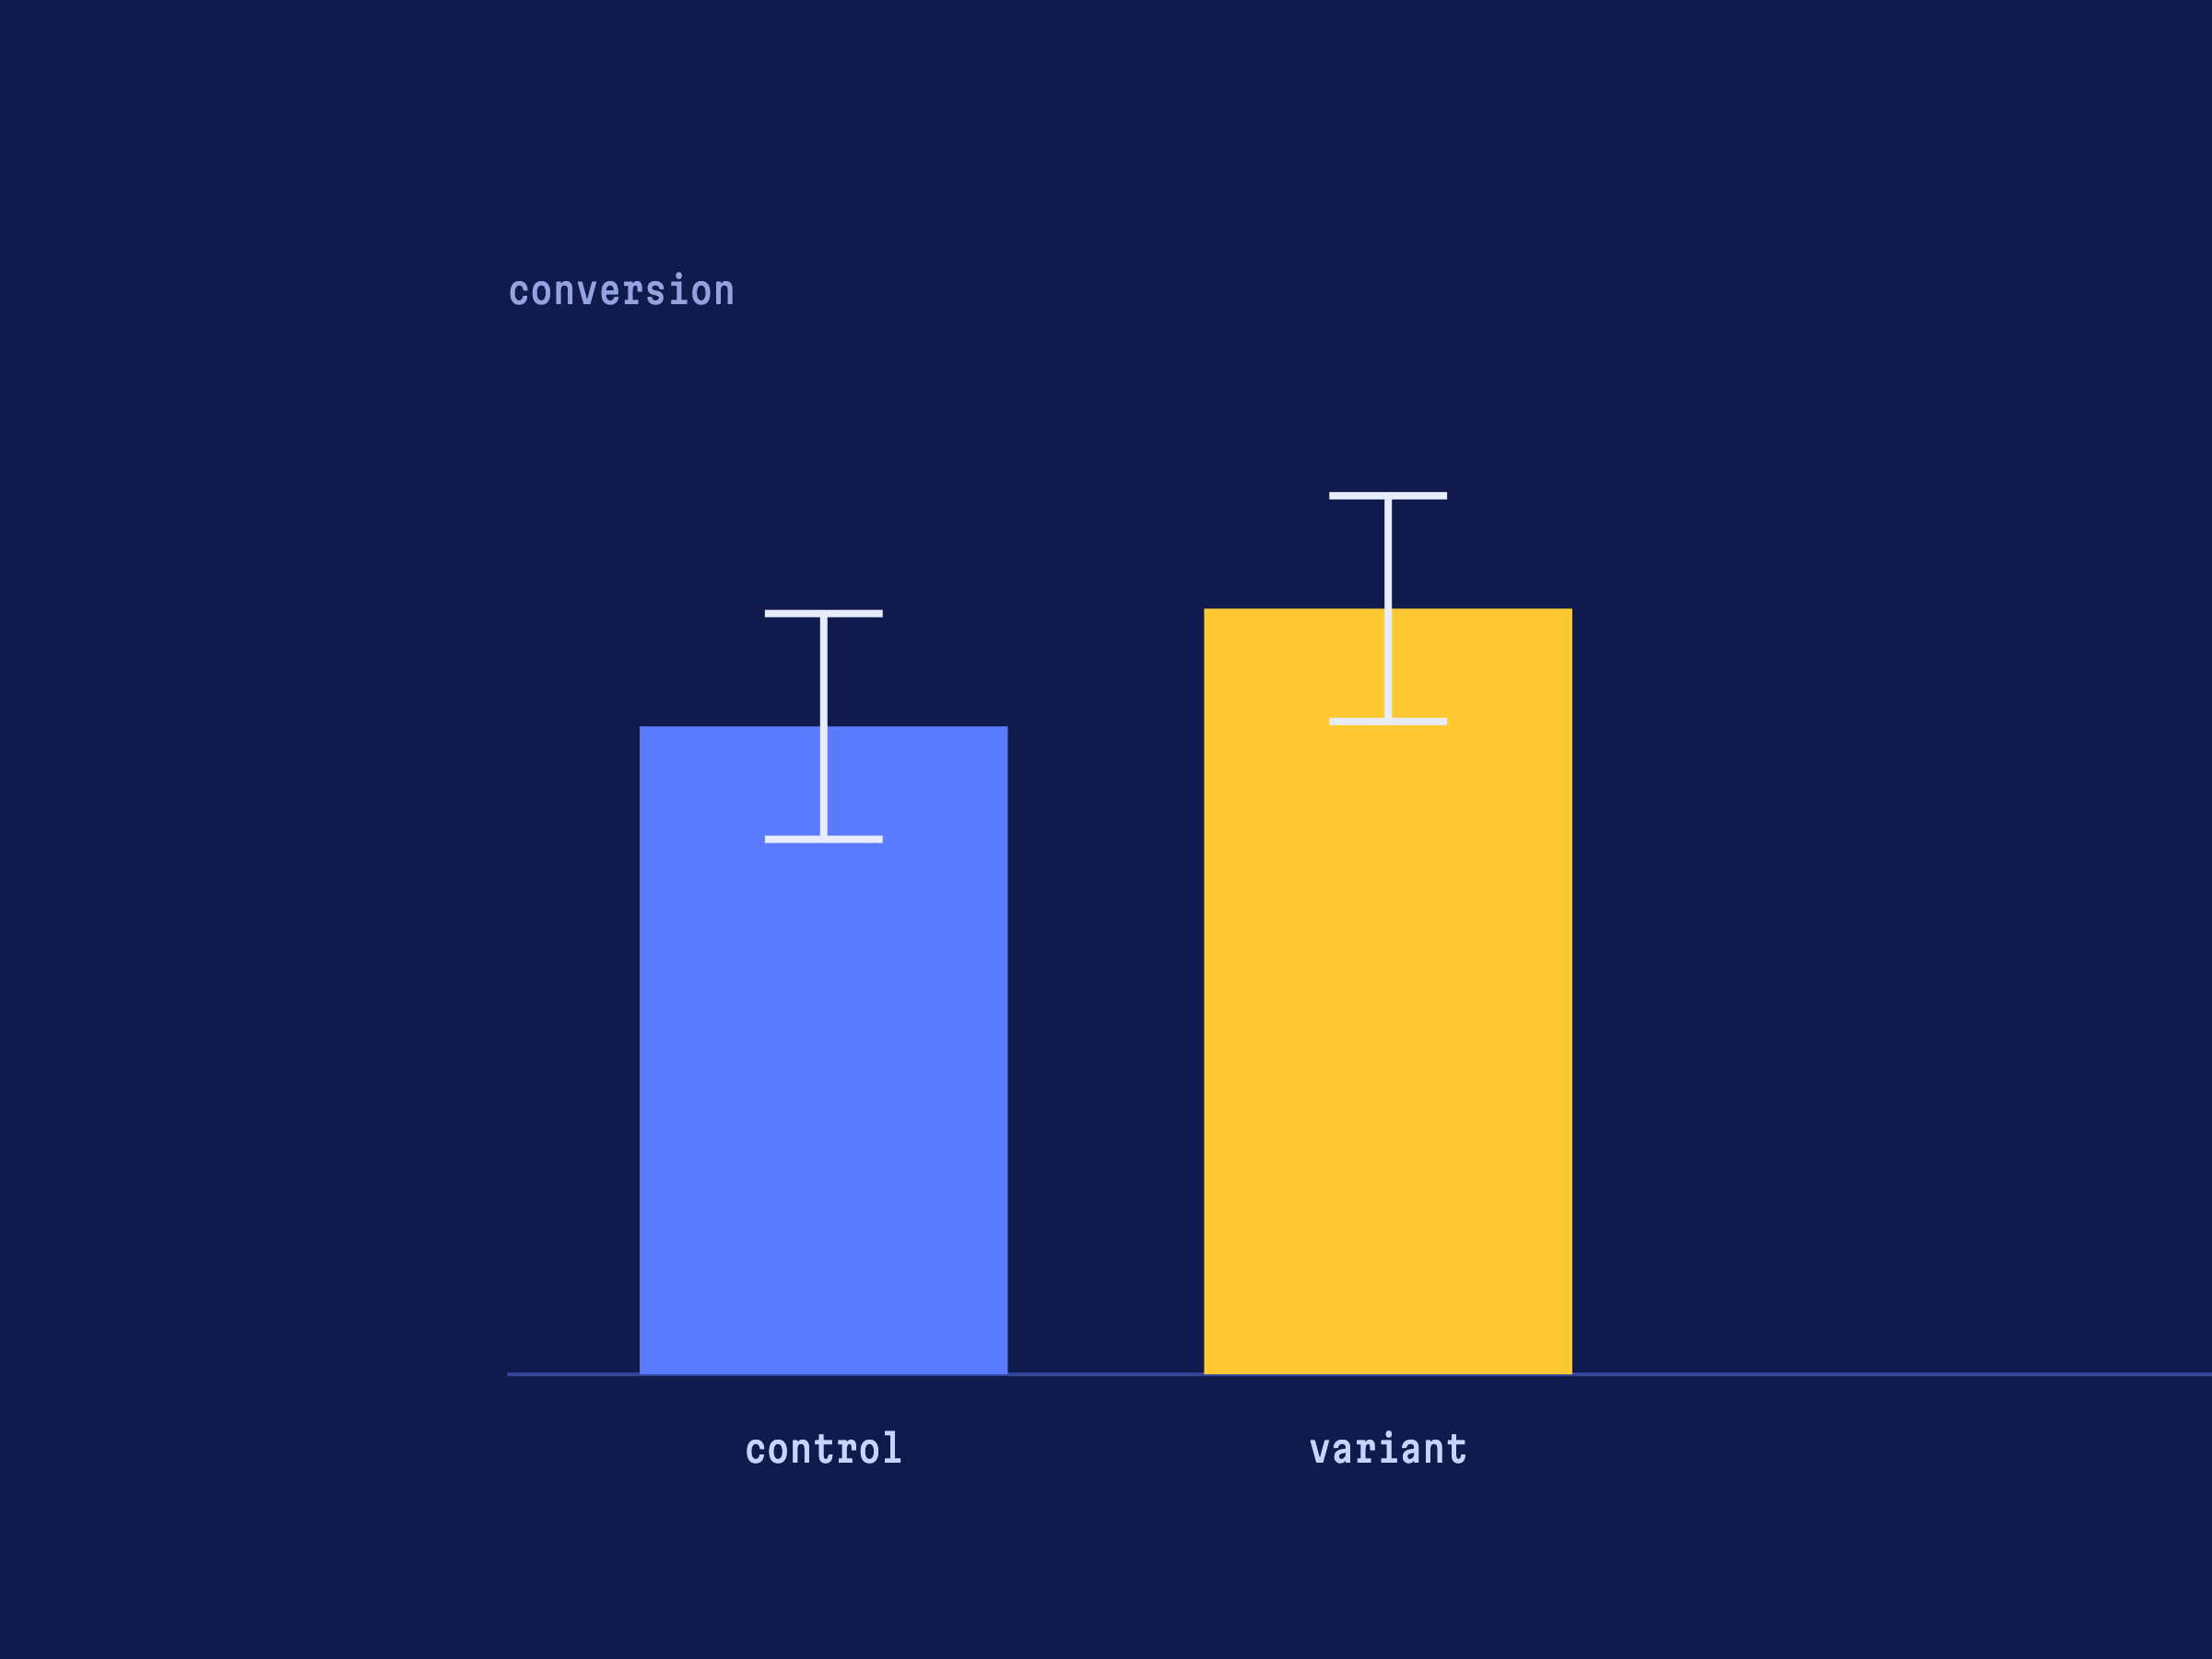
Take a treatment that makes a page load slower. The users with the slowest connections leave before the exposure event fires, so they never appear in the treatment group. The users who remain are, on average, better connected and more engaged than control, and the treatment can look like a win on conversion when it is a loss. A KDD 2019 paper by Fabijan et al., "Diagnosing Sample Ratio Mismatch in Online Controlled Experiments", describes a real case of this kind: treatment users were classified as bots and dropped from the analysis, and once that was corrected, the result flipped.
The same paper reports that about 6% of experiments at Microsoft showed an SRM. It is not a rare edge case. Because the bias can point either way, you cannot correct it by adjusting the result; you can only find the cause.
Common causes of sample ratio mismatch
Fabijan et al. group causes by the stage of the experiment where they happen: assignment, execution, log processing, analysis, and interference from people or other systems. The table follows that grouping with the causes teams run into most often.
| Stage | Cause | What it looks like |
|---|---|---|
| Assignment | Bucketing or hashing bug | One variant gets more IDs than configured, or assignment is correlated with another experiment that reuses the same hash seed. |
| Assignment | Identity mismatch | Users are assigned on an anonymous or device ID and analyzed on a logged-in user ID, so some users show up in both variants. |
| Execution | Redirects or slower loading in one variant | Users leave before the variant renders and the exposure event fires, so that variant loses users. |
| Execution | Exposure logged at different points | Control logs the exposure on page load, treatment on a later interaction, so the two groups are counted differently. |
| Log processing | Telemetry loss or bot filtering | A variant that crashes, drops events or changes behavior enough to trip a bot filter loses users during processing. |
| Analysis | Filters or triggers that depend on the variant | The analysis keeps only users who saw a component, and the component exists or behaves differently in one variant. |
| Analysis | Allocation changed mid-test | The test ramped from 10/90 to 50/50, and the whole window is compared against the final ratio. |
| Interference | Manual or system overrides | Internal users are forced into treatment, or another experiment or a targeting rule removes users from one variant. |
How to detect SRM with a chi-square test?
The standard check is a chi-square goodness-of-fit test. It compares the observed user count in each variant with the count you expected from the planned allocation:
expected users in variant i   E_i = total users × planned share of variant i
chi-square                    χ² = Σ (O_i − E_i)² / E_i
degrees of freedom            df = number of variants − 1
A large χ² means the observed counts are far from the plan. The p-value is the probability of a χ² at least that large if assignment really followed the plan. Count users, not sessions or events: the test assumes each unit was assigned independently, and sessions from the same user are not.
Worked example: is 101,000 vs 99,000 an SRM?
A checkout test is configured as 50/50. After two weeks the exposure data has 101,000 users in control and 99,000 in treatment, 200,000 in total.
Expected counts
Each variant should have 200,000 × 0.5 = 100,000 users.
Contribution of each variant
Control: (101,000 − 100,000)² / 100,000 = 1,000,000 / 100,000 = 10. Treatment: (99,000 − 100,000)² / 100,000 = 10.
Chi-square statistic
χ² = 10 + 10 = 20, with 2 − 1 = 1 degree of freedom.
p-value
For χ² = 20 with 1 degree of freedom, p ≈ 0.0000077, about 1 in 130,000. That is far below 0.001, so the test has an SRM.
Run the same arithmetic on 1,010 vs 990 users and each variant contributes 10² / 1,000 = 0.1, so χ² = 0.2 and p ≈ 0.65. Same ratio, no evidence of a problem. If you want to check a p-value outside SQL, scipy.stats.chisquare([101000, 99000]) in Python returns the statistic and p-value for an equal split; pass f_exp with the expected counts for any other split.
Why the threshold is p < 0.001, not 0.05?
The SRM check runs on every experiment, often every day while the test is live. At p < 0.05, one healthy test in twenty would raise a false alarm, and people would learn to ignore the alarm. A threshold of p < 0.001 keeps false alarms to one in a thousand checks, and real SRM caused by a bug usually clears it by a wide margin once the test has a few thousand users per variant. Some teams use an even stricter cutoff.
The flip side is that a small test has little power to detect SRM, so a passing check on 500 users says less than a passing check on 50,000.
Because no warehouse has a built-in chi-square distribution function that works everywhere, it is easiest to compare χ² with the critical value for your number of variants:
| Variants | Degrees of freedom | χ² critical value at p = 0.001 |
|---|---|---|
| 2 | 1 | 10.83 |
| 3 | 2 | 13.82 |
| 4 | 3 | 16.27 |
Unequal splits work the same way. For a 90/10 test on 50,000 users, the expected counts are 45,000 and 5,000, and each variant's contribution is still (O − E)² / E. Use the allocation the users were actually assigned under: if the split changed during the test, check each period separately.
How to check SRM in SQL on your warehouse?
Most experimentation tools, and most in-house assignment services, write an exposure record to the warehouse when a user first sees a variant. Modeling A/B tests in the data warehouse covers how to model that table. The queries below assume one like this:
analytics.experiment_exposures
  user_id           the unit that was randomized
  experiment_id     e.g. 'checkout_redesign'
  variant           e.g. 'control', 'treatment'
  first_exposed_at  timestamp of the user's first exposure to that variant
The query collapses the exposures to one row per user, so duplicate exposure records don't inflate the counts, and sets aside users who appear in more than one variant. It then counts users per variant, computes the expected count from the planned shares, and returns each variant's contribution to χ² and the total.
WITH planned AS (
  SELECT 'control' AS variant, 0.5 AS planned_share
  UNION ALL
  SELECT 'treatment' AS variant, 0.5 AS planned_share
),

user_variants AS (
  SELECT
    user_id,
    MIN(variant)            AS variant,
    COUNT(DISTINCT variant) AS variant_count
  FROM analytics.experiment_exposures
  WHERE experiment_id = 'checkout_redesign'
    AND first_exposed_at >= '2026-10-01'
    AND first_exposed_at <  '2026-10-15'
  GROUP BY user_id
),

observed AS (
  SELECT variant, COUNT(*) AS users
  FROM user_variants
  WHERE variant_count = 1
  GROUP BY variant
),

totals AS (
  SELECT SUM(users) AS total_users
  FROM observed
),

per_variant AS (
  SELECT
    p.variant,
    COALESCE(o.users, 0)            AS observed_users,
    t.total_users * p.planned_share AS expected_users
  FROM planned AS p
  CROSS JOIN totals AS t
  LEFT JOIN observed AS o
    ON o.variant = p.variant
)

SELECT
  variant,
  observed_users,
  expected_users,
  ROUND(observed_users * 1.0 / SUM(observed_users) OVER (), 4)
    AS observed_share,
  POWER(observed_users - expected_users, 2) / expected_users
    AS chi_square_part,
  SUM(POWER(observed_users - expected_users, 2) / expected_users) OVER ()
    AS chi_square
FROM per_variant
ORDER BY variant;
On the worked example, it returns this. With two variants the critical value is 10.83, and 20 is well above it.
| variant | observed_users | expected_users | observed_share | chi_square_part | chi_square |
|---|---|---|---|---|---|
| control | 101000 | 100000 | 0.5050 | 10.0 | 20.0 |
| treatment | 99000 | 100000 | 0.4950 | 10.0 | 20.0 |
Two details matter. The planned rows must use the same variant labels as the exposure table: a label that isn't in planned still counts toward the total but gets no row of its own, and the expected counts will no longer add up to the observed ones. That mismatch is worth catching anyway, since an unexpected variant name is a bug of its own. And the planned CTE uses UNION ALL rather than VALUES so the query runs on BigQuery as well as Snowflake, Databricks, Redshift and Postgres.
Count users who appear in more than one variant
Users seen in more than one variant are excluded from the SRM counts above, so report them separately. A handful is normal, from shared devices or ID merges. More than a fraction of a percent usually points to an identity or assignment problem, and if they lean toward one variant they can be the cause of the SRM.
WITH user_variants AS (
  SELECT
    user_id,
    COUNT(DISTINCT variant) AS variant_count
  FROM analytics.experiment_exposures
  WHERE experiment_id = 'checkout_redesign'
    AND first_exposed_at >= '2026-10-01'
    AND first_exposed_at <  '2026-10-15'
  GROUP BY user_id
)

SELECT
  COUNT(*) AS exposed_users,
  SUM(CASE WHEN variant_count > 1 THEN 1 ELSE 0 END) AS users_in_several_variants,
  ROUND(
    SUM(CASE WHEN variant_count > 1 THEN 1 ELSE 0 END) * 1.0 / COUNT(*),
    4
  ) AS share_in_several_variants
FROM user_variants;
Then run the SRM query on slices, not only on the whole test. Add a filter or a group for the first exposure date, platform, browser, country or new versus returning users. An SRM that shows up only on day one often comes from caching or a delayed start of one variant; an SRM confined to one browser or app version points at that client. Each slice is a separate test, so expect the occasional false alarm when you check many of them and look for a pattern rather than a single low p-value.
What to do when you find SRM?
- Stop reading the results. Don't ship, and don't report the lift, until the cause is known. A p-value on the outcome metric means nothing when the groups are not comparable.
- Check the obvious first. Confirm the planned allocation in the experimentation tool matches the one in your query, that the split didn't change during the test, and that the variant labels match.
- Slice it. Break the SRM down by day, platform, browser, country and new versus returning users. A localized SRM narrows the search to one client, one release or one date.
- Compare stages. Count users per variant in the assignment logs, in the raw exposure events and in the modeled exposure table. The stage where the counts diverge is the stage where users were lost.
- Look at filters and triggers. If the full population is balanced and a filtered analysis is not, the filter depends on the variant. Relax it until the SRM disappears.
- Fix and rerun. Dropping the extra users or reweighting the groups does not remove the bias, because you don't know which users are missing. Fix the cause and run the test again, or restart the analysis window after the fix.
Once the split is healthy, the usual statistics apply. A/B testing statistics for beginners walks through significance, confidence intervals and power for the outcome metrics themselves.
SRM checks next to the results
The SQL above is worth having, but a check people have to remember to run gets skipped on the test that needed it. It works best when it sits next to the result. That is how experiment analysis in Mitzu works: Mitzu reads A/B test exposures from your warehouse and reports lift, confidence intervals, guardrails and health checks on the same metrics your business reports, while your experimentation tool keeps assigning users. The health checks run on every test: whether traffic is split as planned, how many users appear in several variants, and how much of the test window the results cover. They sit beside the KPIs, so a split problem is visible before anyone reads the lift. Start free on your warehouse, or book a demo and see it on your own experiments.
FAQ
What is sample ratio mismatch in A/B testing?
Sample ratio mismatch (SRM) is when the number of users in each variant of an A/B test differs from the planned split by more than random chance can explain. For example, a 50/50 test with 101,000 users in control and 99,000 in treatment has an SRM. It signals a problem in assignment, exposure logging, data processing or analysis, and the test's results should not be trusted until the cause is found.
How do you calculate sample ratio mismatch with a chi-square test?
Compute the expected users per variant as total users times the planned share, then sum (observed − expected)² / expected across variants. Compare the result with the chi-square distribution with (number of variants − 1) degrees of freedom. For 101,000 vs 99,000 on a 50/50 split, χ² = 10 + 10 = 20 with 1 degree of freedom, and p ≈ 0.0000077.
What p-value threshold should I use for SRM?
The conventional threshold is p < 0.001. The SRM check runs on every experiment, often daily, so a 0.05 threshold would flag one healthy test in twenty. For two variants, p < 0.001 corresponds to a chi-square statistic above 10.83; for three variants, above 13.82.
Can I fix SRM by removing extra users or reweighting the variants?
No. SRM means users were lost or added in a way that is probably related to the variant, so the users who remain are not comparable between groups. Trimming the larger group or reweighting fixes the counts but not the bias. Find the root cause, fix it, and rerun the test or restart the analysis window.
How common is sample ratio mismatch?
Common enough to check on every test. Fabijan et al. (KDD 2019) report that about 6% of experiments at Microsoft exhibited an SRM. At that rate, a team running a thousand tests a year should expect around 60 of them.