TL;DR
Learn how to build a high-impact data team that delivers results with self-service tools, warehouse-native analytics, and clear priorities. Imagine you are a data leader.
Imagine you are a data leader. Your team is expected to help the business make smarter, faster decisions using data. The potential impact is huge, and everyone’s looking to you to deliver. But in practice, it’s easy to get caught up in building complex pipelines, trying out the latest tools, or optimizing for edge cases that may never come up.
These projects often look great in presentations, but they don’t always lead to real, measurable results. Meanwhile, stakeholders are still struggling to get the insights they need. Data requests pile up. Teams work in silos.
And despite all the effort, the business isn’t moving forward as quickly as it could.
The real opportunity comes when you shift focus. Instead of chasing complexity, you double down on what matters most: clear governance, clean integrations, and giving teams consistent access to the data they need. When you approach data with a practical, collaborative mindset, you move beyond being just a technical team. You become a strategic partner. So how do you build a data team that can actually deliver on that promise? Here are five things to get right from the start.
1. Understand Business Needs and Align Data Efforts
It’s easy to get caught up in the technicalities of data warehouses or data lakes. However, the most effective data teams begin by connecting with business leaders to understand their challenges and the factors that drive their decisions. Your data team needs to focus on what truly matters to the business, not just the latest technical trends. Begin by engaging directly with business leaders to understand their challenges and opportunities.
What decisions are they struggling with? Which metrics drive their strategy? When you connect your data work to these concrete needs, you demonstrate how analytics directly impacts the bottom line.
2. Define Ownership and Accountability in Data Projects
Nothing undermines data initiatives faster than ambiguous responsibility. For each project, designate a clear owner accountable for delivery from inception to completion. Define what success looks like with measurable goals and specific deliverables. This clarity helps team members understand their roles and fosters a sense of ownership that elevates quality standards
When team members have a sense of ownership, they are more invested in delivering high-quality work and maintaining data integrity throughout the process. This clarity not only drives better outcomes but also creates space to celebrate wins, learn from setbacks, and build a culture of accountability and continuous improvement.
3. Break Down Data Silos with Cross-Team Collaboration
Self-service tools are essential for effective collaboration across departments, breaking down silos and ensuring everyone has access to the insights they need to make informed decisions. These capabilities democratize analytics, allowing non-technical team members from marketing to sales teams to explore data independently without SQL knowledge. You can keep everyone aligned and engaged.
| Team | What Self-Service Tools Enable | Business Benefit |
|---|---|---|
| Marketing | Analyze campaigns, segment audiences | Faster pivots, targeted strategies |
| Sales | Track leads, monitor pipelines | Spot opportunities, close deals faster |
| Product | Monitor feature adoption, gather user feedback | Build what users want, improve faster |
| Finance | Access real-time financial data, track KPIs | Quicker, data-backed decisions |
| Operations | Optimize processes, monitor supply chain | Boost efficiency, reduce bottlenecks |
| Data Team | Focus on advanced analytics, data quality, governance | Drive innovation, support all teams |
| All Teams | Create and share dashboards, collaborate on insights | Break down silos, align strategies |
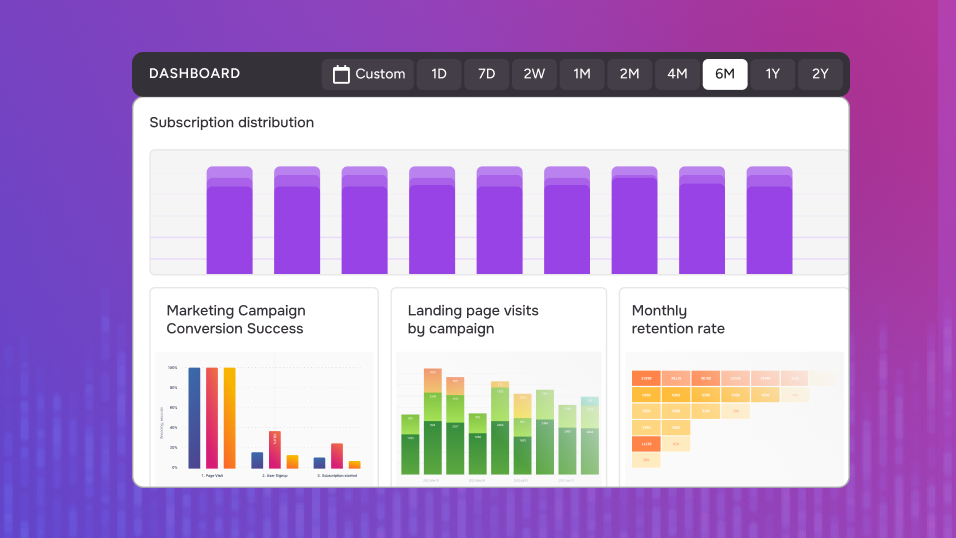
Making dashboards accessible to non-technical teams empowers better decisions and fosters a stronger data-driven culture that stays aligned with business goals.
4. Optimize and Simplify Your Modern Data Stack
As your data ecosystem grows, it’s easy for tools, platforms, and processes to pile up, often faster than expected. Over time, this complexity becomes harder to manage and more expensive to maintain. That’s why it’s important to regularly step back and review your stack. Look at your data warehouse, data lake, and other tools with a critical eye, and be willing to retire anything that isn’t delivering real value.
Automating routine tasks can also help your team focus on higher-impact work.
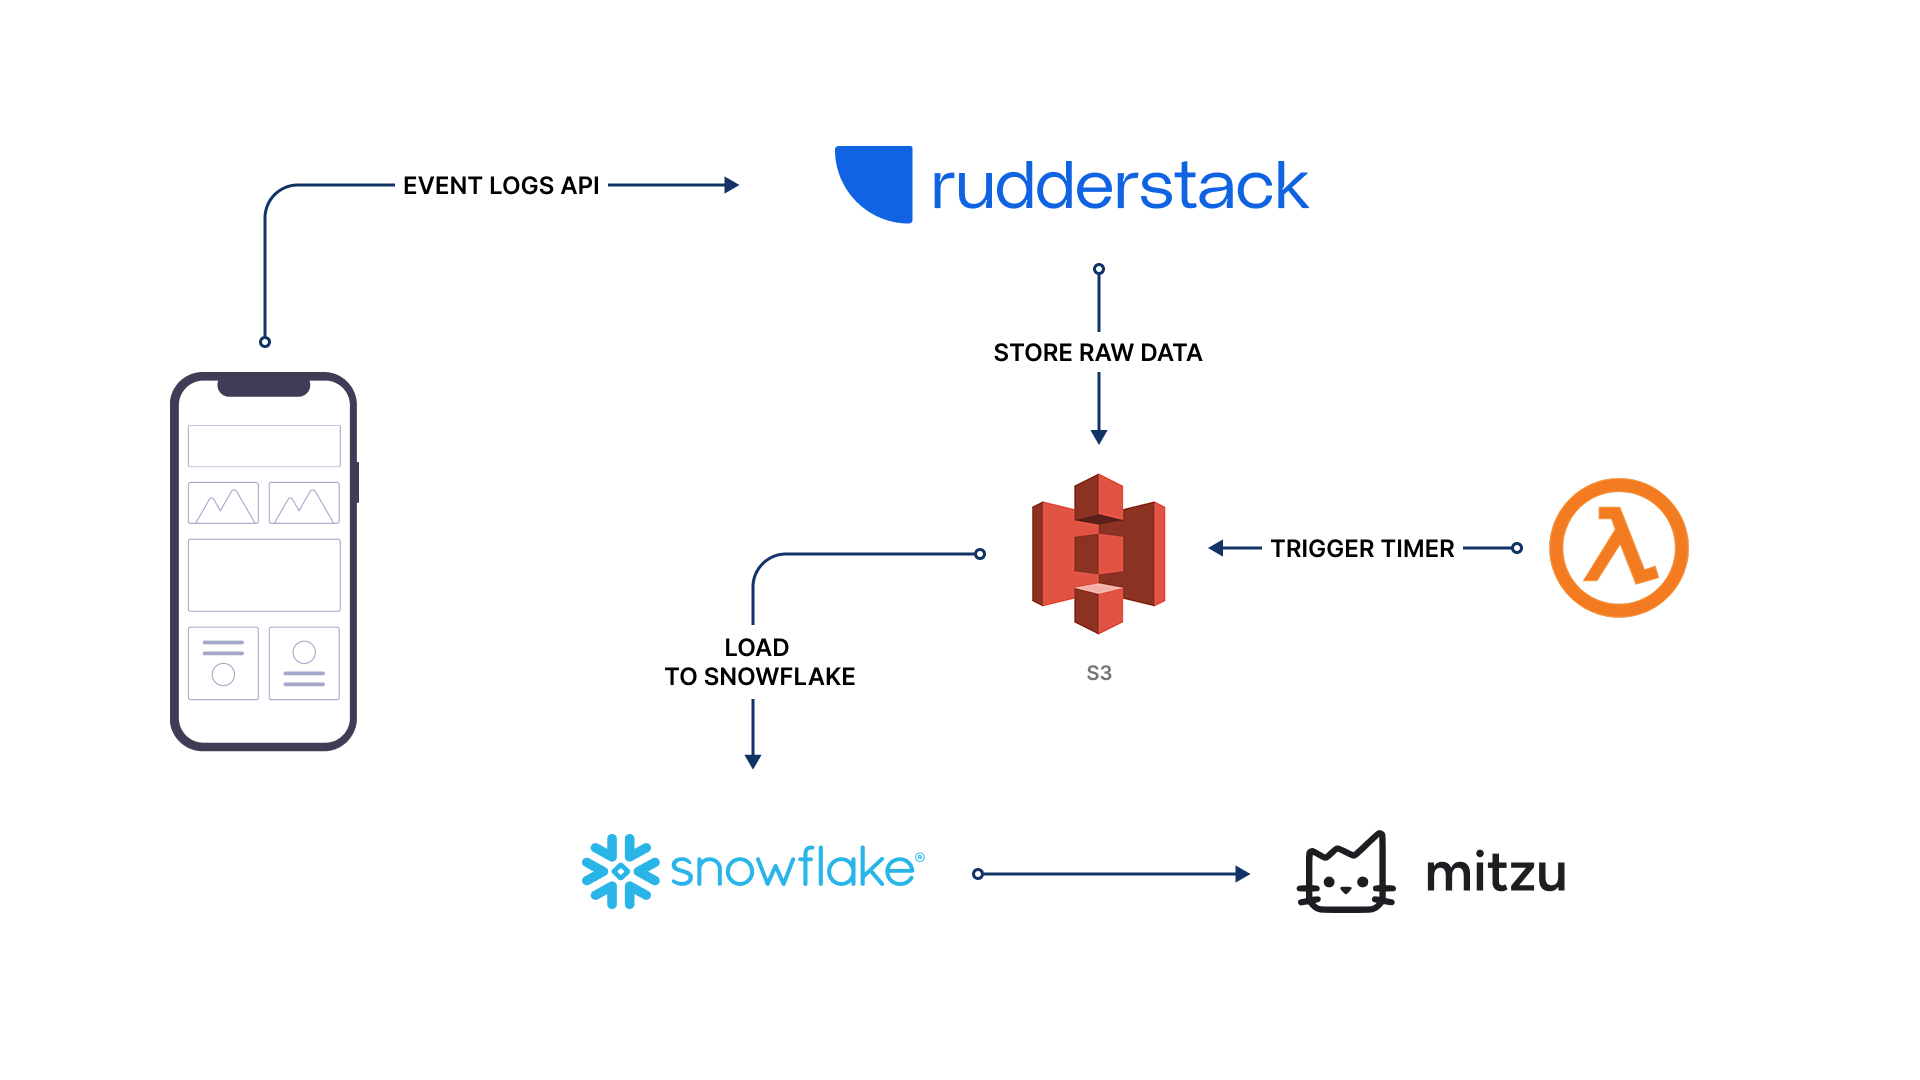
And by keeping a close watch on costs, you can make sure your data operations stay efficient and scalable over timeA modern data stack typically includes several key components:
- Data storage and querying (MySQL, PostgreSQL, Snowflake)
- Backend frameworks
- Frontend frameworks
- API services
- Monitoring and performance tools
- Business intelligence solutions
- Behavioral and product analytics
A lean, well-integrated data stack is easier to manage and cheaper to run. It also makes it simpler for new team members to get up to speed and for other departments to understand how data supports their work.
5. Measure What Matters and Share Your Impact
f you don’t track your progress, you won’t know if you’re making a difference. Track and communicate your team's contributions with comprehensive metrics that Mitzu can calculate across product, marketing, and revenue analytics.
For product teams, Mitzu provides real-time data tracking, user segmentation, funnel analysis, cohort analysis, retention analysis, user journey mapping, and anomaly detection. Marketing teams benefit from cross-platform analytics, A/B testing, event tracking, and behavioral analytics to optimize campaigns and measure performance. Revenue analytics capabilities include monthly recurring revenue (MRR) tracking, subscriber metrics, customer acquisition cost (CAC), customer lifetime value (CLV), churn rate analysis, and expansion revenue measurement.
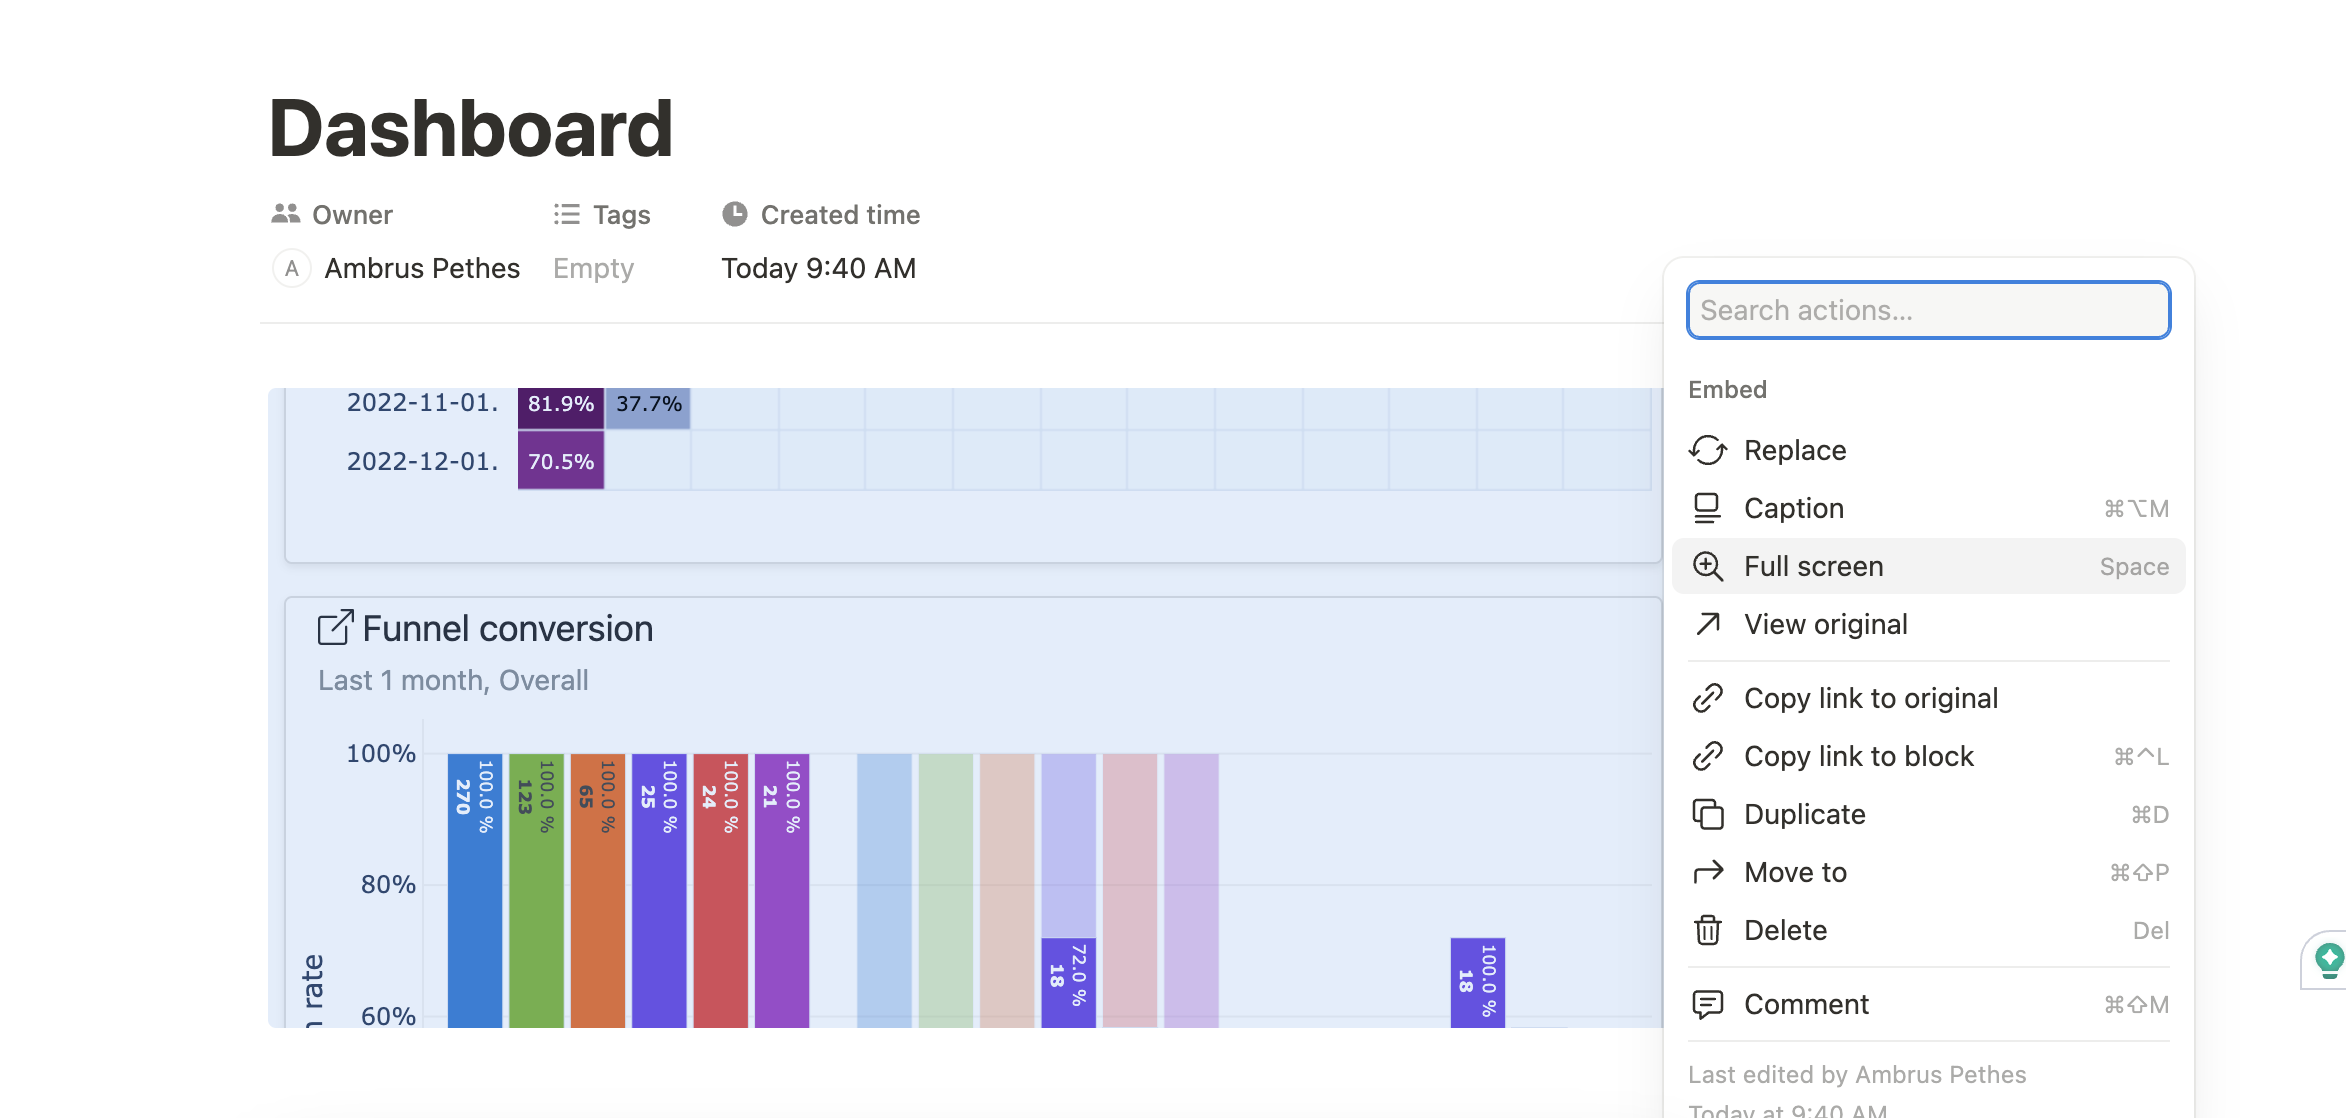
Share these insights with your team and stakeholders, so everyone sees the value of your work and where improvements are possible. For instance, in Mitzu, you can embed dashboards into a Notion page, and Notion will automatically create an interactive preview, just like with Miro. You can also export it as a PDF, making it easy to share key findings with anyone, even without signing in.
What Are the Key Takeaways?
When your data team has the right focus, clear ownership, and easy-to-use tools, they can deliver insights that truly move the business forward. By making data accessible to everyone and measuring what matters, you turn analytics into real-world results. Ultimately, it’s this practical, collaborative approach that transforms your data team into a key driver of growth and informed decision-making.


