TL;DR
Warehouse Metrics (formerly Metric Tables) turns a table or view your data team already maintains, often a dbt model, into metrics you can chart in Mitzu, with no remodelling and no copy of your data outside the warehouse. Roll-up rules make longer periods correct: add up for revenue, use the latest value for MRR, or pick average, median, percentiles, lowest, highest, or don't roll up for rates. Warehouse metrics break down by your entities' properties, combine with event metrics in formulas such as revenue per active user, and work on dashboards and in the Analytics Agent.
Warehouse Metrics is new in Mitzu: define your own metrics and KPIs in your data warehouse, then visualize them in Mitzu on any chart or dashboard. It is built for the data analysts and analytics engineers who own the warehouse and the dbt models, and for the product, growth and leadership teams who want those numbers next to the user behaviour that moves them.
Some numbers are not built from events. MRR, revenue booked, active subscriptions and support ticket counts usually live in tables your data team already maintains in Snowflake, BigQuery, Databricks, Redshift, ClickHouse or a similar warehouse. Warehouse Metrics, formerly called Metric Tables, brings those numbers into Mitzu without remodelling them. It is the second release of Mitzu Launch Week.
The case for Warehouse Metrics
Product analytics runs on events: signups, page views, feature usage, checkouts. The questions product teams ask, though, keep reaching for numbers that never were events.
- The business numbers live in modelled tables. MRR is calculated from subscriptions, discounts, upgrades and cancellations, usually in a dbt model that took real work to get right. It is not something you can count from one event.
- Rebuilding them from events creates a second version. When a product analytics tool recalculates revenue from its own events, its number drifts from the finance team's. Nobody trusts either, and every review starts with reconciling them.
- The interesting questions need both sides. Revenue per active user, MRR by the industry of the company, support tickets per weekly active account: each one combines a business number with behaviour.
- The definition belongs in one place. Your data team already versions, tests and reviews its models. The metric should be read from there, not redefined in a dashboard tool.
Warehouse Metrics reads the modelled table as it is. Mitzu stays an agentic product analytics platform, not a BI tool: the point is to put the business numbers your warehouse already holds next to the behavioural analysis Mitzu does, on the same charts, dashboards and agent. It follows from the same warehouse-native idea as the rest of the product: native joins to data you already have, and no copy of your data outside the warehouse.
Benefits at a glance
| Benefit | What it means in practice |
|---|---|
| One definition of revenue | Mitzu reads the number your data team already calculates. The chart in Mitzu and the finance report come from the same model. |
| No remodelling | Point Mitzu at an existing table or view, such as a dbt model. Mitzu reads the column list from its definition; there is nothing to rewrite. |
| Correct roll-ups | Each metric has a roll-up rule, so weekly or monthly views of MRR, balances or backlogs mean what they should. |
| Break downs by your entities | An identifier column joins the entity's dimension tables, so MRR breaks down by industry, plan or region like any event metric. |
| Next to behaviour | Use a warehouse metric in a formula with an event metric, for example revenue booked per user who logged in. |
| Available to the agent | Ask the Analytics Agent "What was our MRR by plan in September?" and it builds the insight on the warehouse metric. |
Rows, columns and roles: how it works
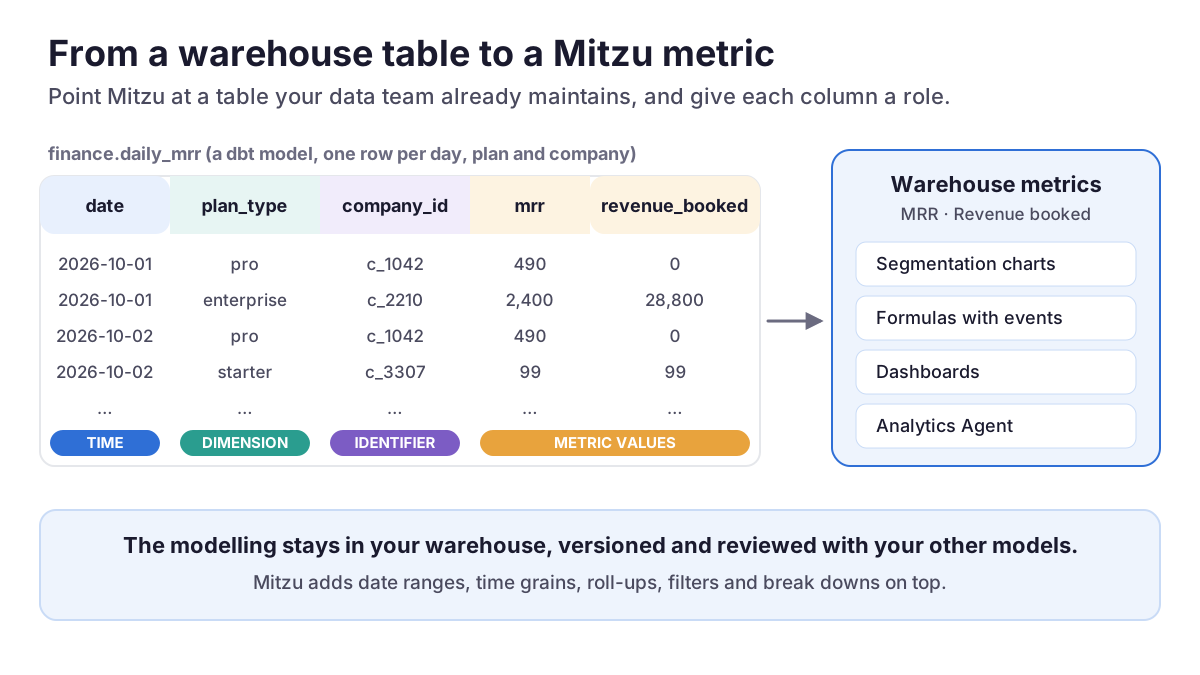
A metric table is a table or view in your warehouse where each row covers one period, for example one day, and optionally one plan, company or region. Mitzu turns every value column into a metric. The one join Mitzu adds is to your dimension tables, when a column identifies an entity. Each column gets one role:
| Role | Use it for | Example |
|---|---|---|
| Time | The date or timestamp of the row. At most one column, and it must be a date or timestamp. Without one, each metric is a single number, such as current ARR. | date |
| Metric value | A number you want to chart. Give it a metric name and a roll-up rule. | mrr |
| Dimension | A column to break down and filter by. It can be linked to a matching event or entity property, so one insight filter applies to both. | plan_type |
| Identifier · Entity | A column that holds an entity's ID. The entity's dimension tables are joined on it. | company_id |
| Ignore | Columns Mitzu doesn't use. | _loaded_at |
Roll-up rules: what a longer period shows
A daily table viewed by week or month needs a rule for turning many rows into one number, and the right rule depends on the metric. Summing daily revenue gives weekly revenue. Summing daily MRR gives a number that means nothing.
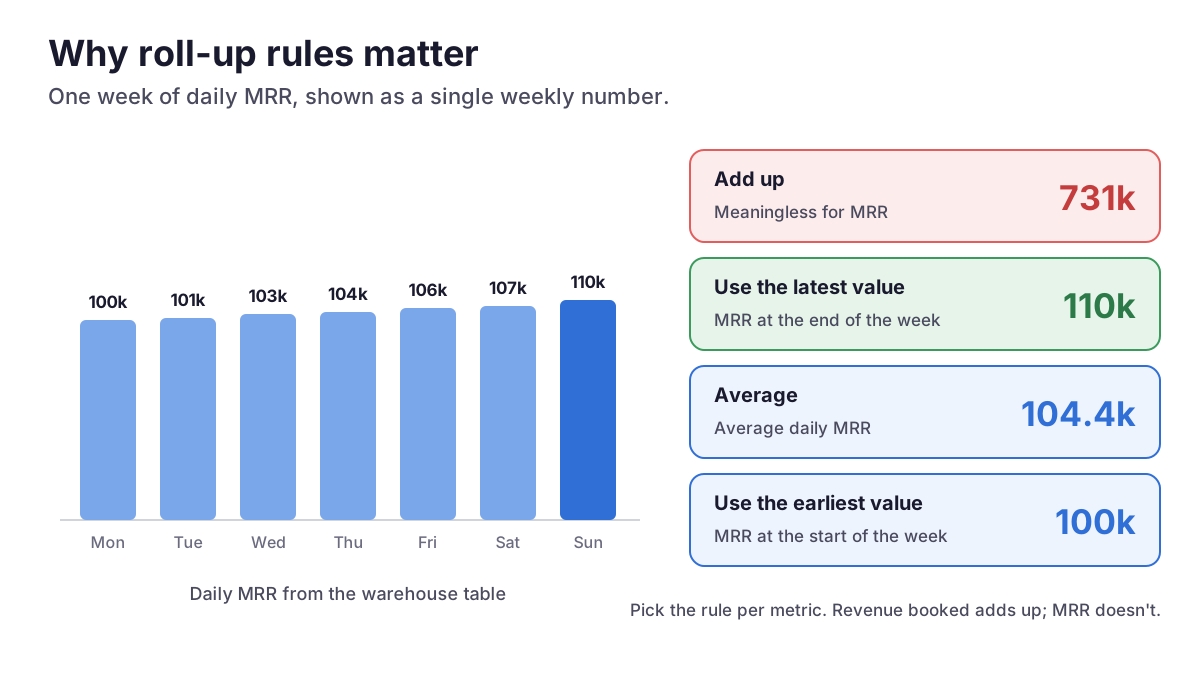
| Rule | Use it for | A week of daily rows shows |
|---|---|---|
| Add up | Revenue, signups, orders | the sum of its days |
| Use the latest value | MRR, active subscriptions, balances | its last day |
| Use the earliest value | Opening balances, MRR at the start of a month | its first day |
| Average | Average daily MRR, average queue length | the average of its days |
| Median, 75th and 90th percentile | A typical day, a busy day, the slow days, without outliers pulling the number around | the median or percentile of its days |
| Lowest and highest value | Lowest daily balance, peak concurrent users | its lowest or highest day |
| Don't roll up | Unique counts, rates | nothing: the metric is shown only at the grain one row has |
Rates deserve a note. Averaging daily conversion rates ignores how many users each day had. Pick Don't roll up, or add the two parts (orders and visitors) as separate metrics and divide them with a formula. Median and percentiles interpolate between rows the same way on every warehouse, like PERCENTILE_CONT in SQL.
Step by step: from a dbt model to a chart
Step 1: Have a table or view with one row per period
Most teams already have one. If not, a small dbt model on top of an existing subscription fact table is enough. The time column must be a date or timestamp; a Unix timestamp stored as a number needs converting in the model first.
-- models/finance/daily_mrr.sql
select
    date_day                        as date,
    plan_type,
    company_id,
    sum(mrr)                        as mrr,
    sum(revenue_booked)             as revenue_booked,
    count(distinct subscription_id) as active_subscriptions
from {{ ref('fct_subscription_days') }}
group by 1, 2, 3
Step 2: Add the metric table
In workspace settings, open Metric tables and click Add metric table. Choose the schema and the table or view, the same way as for event tables. The metric table is named after it, for example finance.daily_mrr. Only workspace admins can add and configure metric tables. Then click Next: Columns: Mitzu reads the column list from the table's definition, without reading any rows, and suggests a role for each column from its type.
Step 3: Preview the table (optional)
Preview table is optional: it reads up to 1,000 rows, fills in a sample value for each column and detects how much time one row covers, from hourly to yearly. On BigQuery, previewing a table reads its first rows without running a query, which BigQuery doesn't charge for. A view has no stored rows, so previewing one runs a regular query.
Step 4: Give each column a role
- Time:
date. - Metric value:
mrrnamed MRR with Use the latest value;revenue_bookednamed Revenue booked with Add up;active_subscriptionswith Use the latest value. - Dimension:
plan_type, linked to the matching property when one exists, so an insight filter on plan applies to the metric too. - Identifier · Company:
company_id. A line under the columns says what joins, for example company_id joins 1 Company dimension table, adding Industry, Plan, Region +4.
Each ID should appear once in the dimension table: Mitzu doesn't check this, and a company with two dimension rows would have each of its metric rows counted twice.
Step 5: Save
Click Save. Mitzu blocks saving and says why when there is no metric value column or when more than one column is marked as the time column. To change the grain or the columns later, select the metric table and click Configure.
Step 6: Chart it
In a segmentation insight, click Select an event and pick the metric from Warehouse metric. Choose the date range and time grain, then break it down by a dimension column or any property its identifier joins. A Warehouse metric badge next to the date range names the table, so nobody mistakes it for an event count.
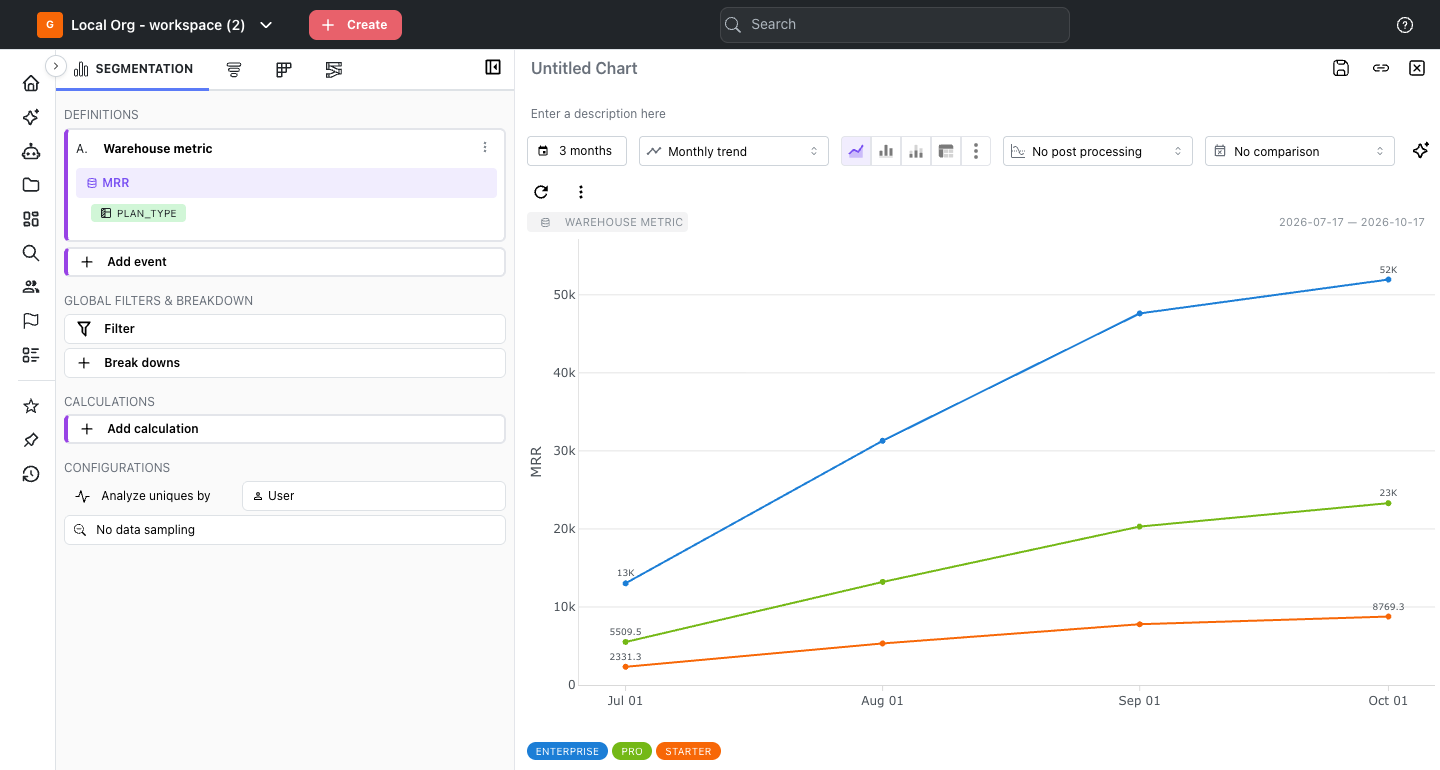
Step 7: Combine it with behaviour
Add an event segment and a formula. With Revenue booked as A and unique users of Login as B, A / B gives revenue per active user, week by week. Both segments use the same date range and time grain, so their periods line up.
Step 8: Put it on a dashboard, or just ask
Save the insight and add it to a dashboard next to activation and retention. Or ask the Analytics Agent in business terms: "What was our MRR by plan in September?" or "Revenue booked per active user each week". The agent sees the same warehouse metrics as the event picker, with their tables, roll-up rules, grains and break downs, and builds a segmentation insight that opens like one you built yourself. When you ask for something the table can't support, such as hourly MRR from a daily table, it says why and offers what it can do.
Good to know
- Where they appear. Warehouse metrics are offered for the first segment of a segmentation insight, not in funnels, retention or journeys, and cohorts don't apply to them.
- Whole periods. On a weekly or monthly table, a date range that starts or ends inside a period counts the whole period, and the chart says so with a badge such as Covers Sep 1 – Oct 31 (whole months). A daily table counts the exact range.
- Entity properties are current. A company's industry or plan comes from its dimension table as it is today, not as it was on the day of the row.
- New columns. Mitzu keeps the column list of a table for up to 24 hours. After adding a column in the warehouse, refresh it from the table picker.
- The name. You set them up as metric tables in workspace settings; in charts, in the agent and on dashboards they are warehouse metrics.
The teams Warehouse Metrics is for
- Analytics engineers and data analysts who already model revenue and subscriptions in dbt, and want product teams to use that definition instead of rebuilding it.
- Product and growth leads who want MRR, revenue and support load next to activation and retention on one dashboard.
- Founders and operators who ask business questions in plain language and want the answer to match the finance report.
FAQ
What is a warehouse metric in Mitzu?
A warehouse metric is a value column of a table or view in your data warehouse, such as MRR or revenue booked, that Mitzu charts like any other metric. The table has one row per period; Mitzu applies date ranges, time grain, roll-up rules, filters and break downs on top, and reads the table in place.
Can I use my dbt models and dbt metrics in Mitzu?
Yes. Any table or view your dbt project materializes in the warehouse can be a metric table, as long as it has a date or timestamp column for time (or no time column at all, for a single current number). Mitzu reads the model's output; it doesn't need dbt Semantic Layer (formerly the dbt metrics layer) or MetricFlow definitions.
How does Mitzu roll up MRR to a month?
With the roll-up rule you pick for the metric. For MRR, choose Use the latest value: each month shows the most recent day that has rows in that month, adding up every row on that day. Summing daily MRR would count the same revenue thirty times.
Is Warehouse Metrics a BI tool?
No. Mitzu is an agentic product analytics platform that runs on your data warehouse. Warehouse Metrics lets it read business numbers your warehouse already holds, so they can sit next to behavioural analysis such as funnels, retention and segmentation. Modelling those numbers stays in your warehouse and your existing tools.
Does my data leave the warehouse?
Mitzu doesn't copy it. It queries the table in place, the same way it queries event tables, and reads back only the query results it needs to draw a chart. The one time it reads raw rows is Preview table: when you click it, Mitzu reads up to 1,000 rows to suggest roles and detect the grain.
Can the Analytics Agent answer questions about warehouse metrics?
Yes. The Analytics Agent sees every warehouse metric with its table, roll-up rule, grain, dimension columns and joined dimension tables. It builds a segmentation insight on the metric, so its answer follows the same rules as a chart you build yourself, and the SQL comes from Mitzu's deterministic query engine.
Related reading
- Track and analyze MRR without data duplication
- What is a semantic layer?
- Warehouse-native analytics: benefits and how it works
- How Mitzu generates verified, trustworthy SQL